AQA · A-Level · Physics
Course version: 7408 · Version from Sept 2016
The p–V diagram (A-level only): Representation of processes on p–V diagram.
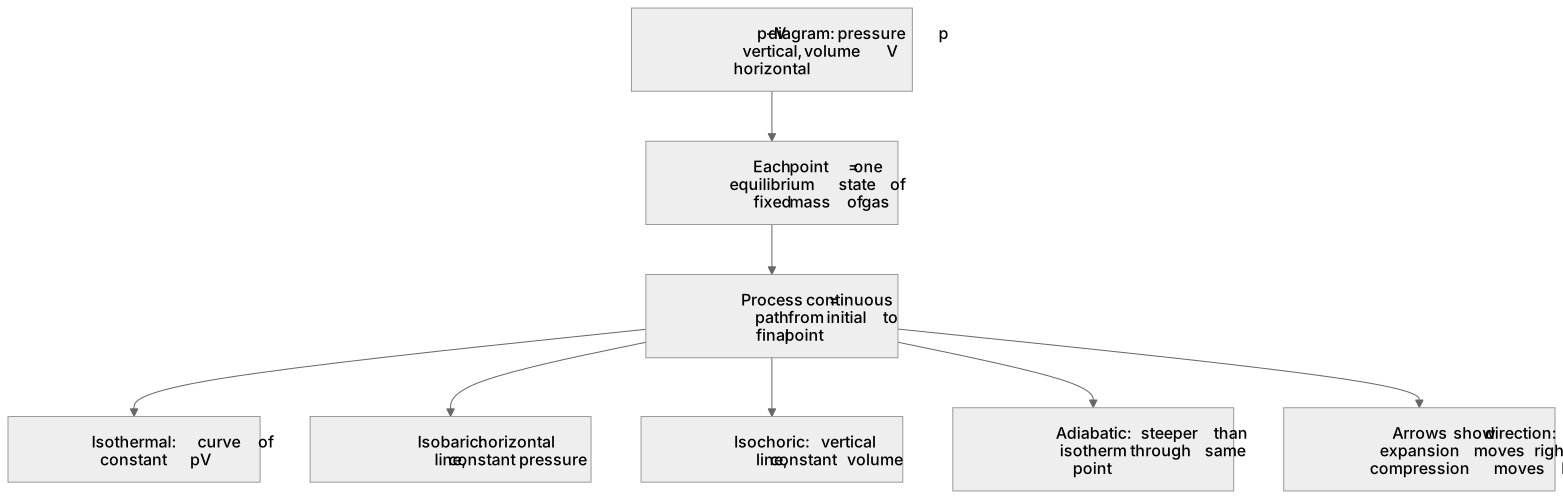
A p–V diagram plots pressure on the vertical axis against volume on the horizontal axis, so each point fixes a unique equilibrium state of a fixed mass of gas.
Checked against the AQA 7408 specification (opens in a new tab) on .
- Point 1 of 2
- 4 key terms
Study notes
From the checked teaching notes for this specification point.
The idea
A p–V diagram plots pressure on the vertical axis against volume on the horizontal axis, so each point fixes a unique equilibrium state of a fixed mass of gas. A process is drawn as a continuous path joining an initial point to a final point. An isothermal change follows a curve of the form pV = constant, a straight horizontal line shows constant pressure (isobaric), a vertical line shows constant volume (isochoric), and an adiabatic change is steeper than the isotherm through the same point. Arrows show direction, so expansion moves right and compression moves left.
For example: A gas expanding at constant pressure from V₁ to V₂ is a horizontal line at p, while the same expansion isothermally curves downwards.
What earns the marks
- Axes are labelled pressure p and volume V with correct units, and the diagram is drawn for a fixed mass of gas.
- Each point on the diagram represents one equilibrium state, and a process is shown as a path with an arrow indicating direction.
- Isothermal processes are drawn as curves of constant pV, isobaric as horizontal lines, and isochoric as vertical lines.
- Adiabatic curves are steeper than isotherms through the same point because temperature changes during the process.
- Expansion is shown moving towards larger V and compression towards smaller V, with the path shape consistent with the stated conditions.
Common mistakes and how to put them right
Labelling the vertical axis as volume and the horizontal axis as pressure.
Put it right: Pressure on the vertical axis and volume on the horizontal axis.
Omitting arrows so the direction of the process is unclear.
Put it right: Add an arrow along the path from initial to final state.
Exam tips
- Sketch axes with labels and units before plotting any path, so the examiner can see the correct orientation immediately.
- Use a dashed guide curve for the isotherm through a point when comparing it with an adiabatic path.
- State the condition for each process, such as constant temperature or constant pressure, next to the relevant line.
Try the lesson
The start of the The p–V diagram (A-level only): Representation of processes on p–V diagram. lesson, made from checked teaching notes for this specification point.
Have a go first
On a p–V diagram, what does a straight horizontal line represent?
Listen
A p–V diagram plots pressure on the vertical axis against volume on the horizontal axis, so each point fixes a unique equilibrium state of a fixed mass of gas. A process is drawn as a continuous path joining an initial point to a final point. An isothermal change follows a curve of the form pV = constant, a straight horizontal line shows constant pressure (isobaric), a vertical line shows constant volume (isochoric), and an adiabatic change is steeper than the isotherm through the same point. Arrows show direction, so expansion moves right and compression moves left. For example, a gas expanding at constant pressure from V₁ to V₂ is a horizontal line at p, while the same expansion isothermally curves downwards. A strong answer earns marks for these points. Axes are labelled pressure p and volume V with correct units, and the diagram is drawn for a fixed mass of gas. Each point on the diagram represents one equilibrium state, and a process is shown as a path with an arrow indicating direction. Isothermal processes are drawn as curves of constant pV, isobaric as horizontal lines, and isochoric as vertical lines. Adiabatic curves are steeper than isotherms through the same point because temperature changes during the process. A common slip: Drawing a process as a straight diagonal line when the statement says isothermal. Instead, draw a curve of constant pV. Exam tip: Sketch axes with labels and units before plotting any path, so the examiner can see the correct orientation immediately.
See it
Key words
Say what each word means before you turn the card.
Equilibrium state
Try answering aloud or in your head before turning the card.
p–V diagram
Try answering aloud or in your head before turning the card.
Isothermal change
Try answering aloud or in your head before turning the card.
Adiabatic change
Try answering aloud or in your head before turning the card.
See every definition
- Equilibrium state
- Each point on a p–V diagram fixes a unique equilibrium state of a fixed mass of gas.
- p–V diagram
- Plots pressure on the vertical axis against volume on the horizontal axis, with a process drawn as a continuous path joining an initial point to a final point.
- Isothermal change
- Follows a curve of the form pV = constant.
- Adiabatic change
- Is steeper than the isotherm through the same point.
Label the diagram
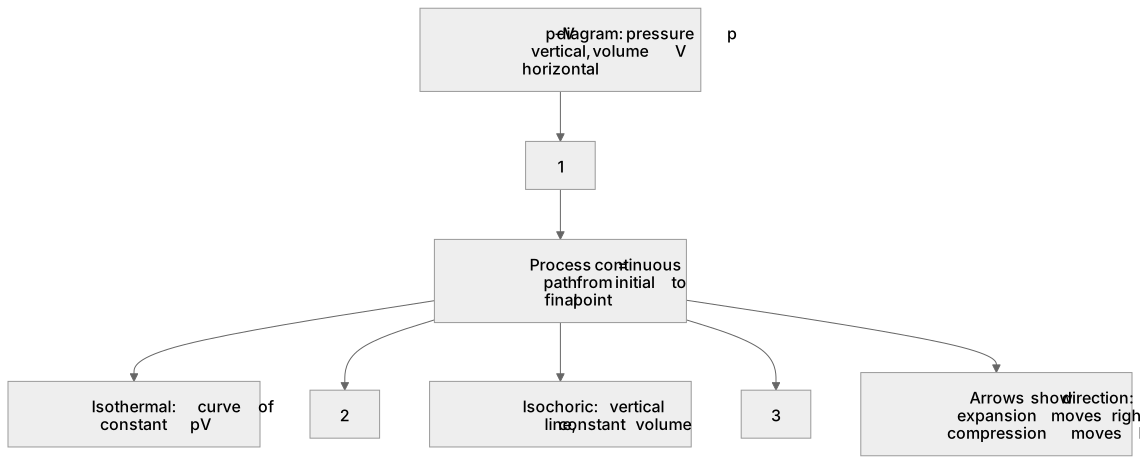
Some boxes have lost their names. Pick the right name for each number.
1Box 1
2Box 2
3Box 3
There is more to this lesson
The full lesson goes on to check your understanding and help you earn the marks. Create a free account to carry on, with your progress saved.
A week of Premium from your first lesson · Then the free plan continues · No card, no charge
Test your understanding of The p–V diagram (A-level only): Representation of processes on p–V diagram.
Active recall beats re-reading. Take an instant quiz now to test what you’ve learned and lock it into long-term memory.
A week of Premium from your first lesson · Then the free plan continues · No card, no charge