OCR · GCSE · Physics
Velocity-time graphs
Master OCR GCSE Physics Topic 1.7: Velocity-Time Graphs. This guide provides everything you need to calculate acceleration and displacement, interpret complex graphs, and avoid common exam pitfalls. Secure top marks with examiner insights, worked examples, and interactive content.
- 6 min read
- 3 worked examples
- 5 practice questions
- 6 key terms
Check what you remember
Read the wording for your board, then hide it and explain Velocity in your own words. Rough notes are fine. This is a self-check, with no mark or grade.
Reference: OCR
The rate of change of displacement. It is a vector quantity, having both magnitude (speed) and direction.
Study Notes
Overview
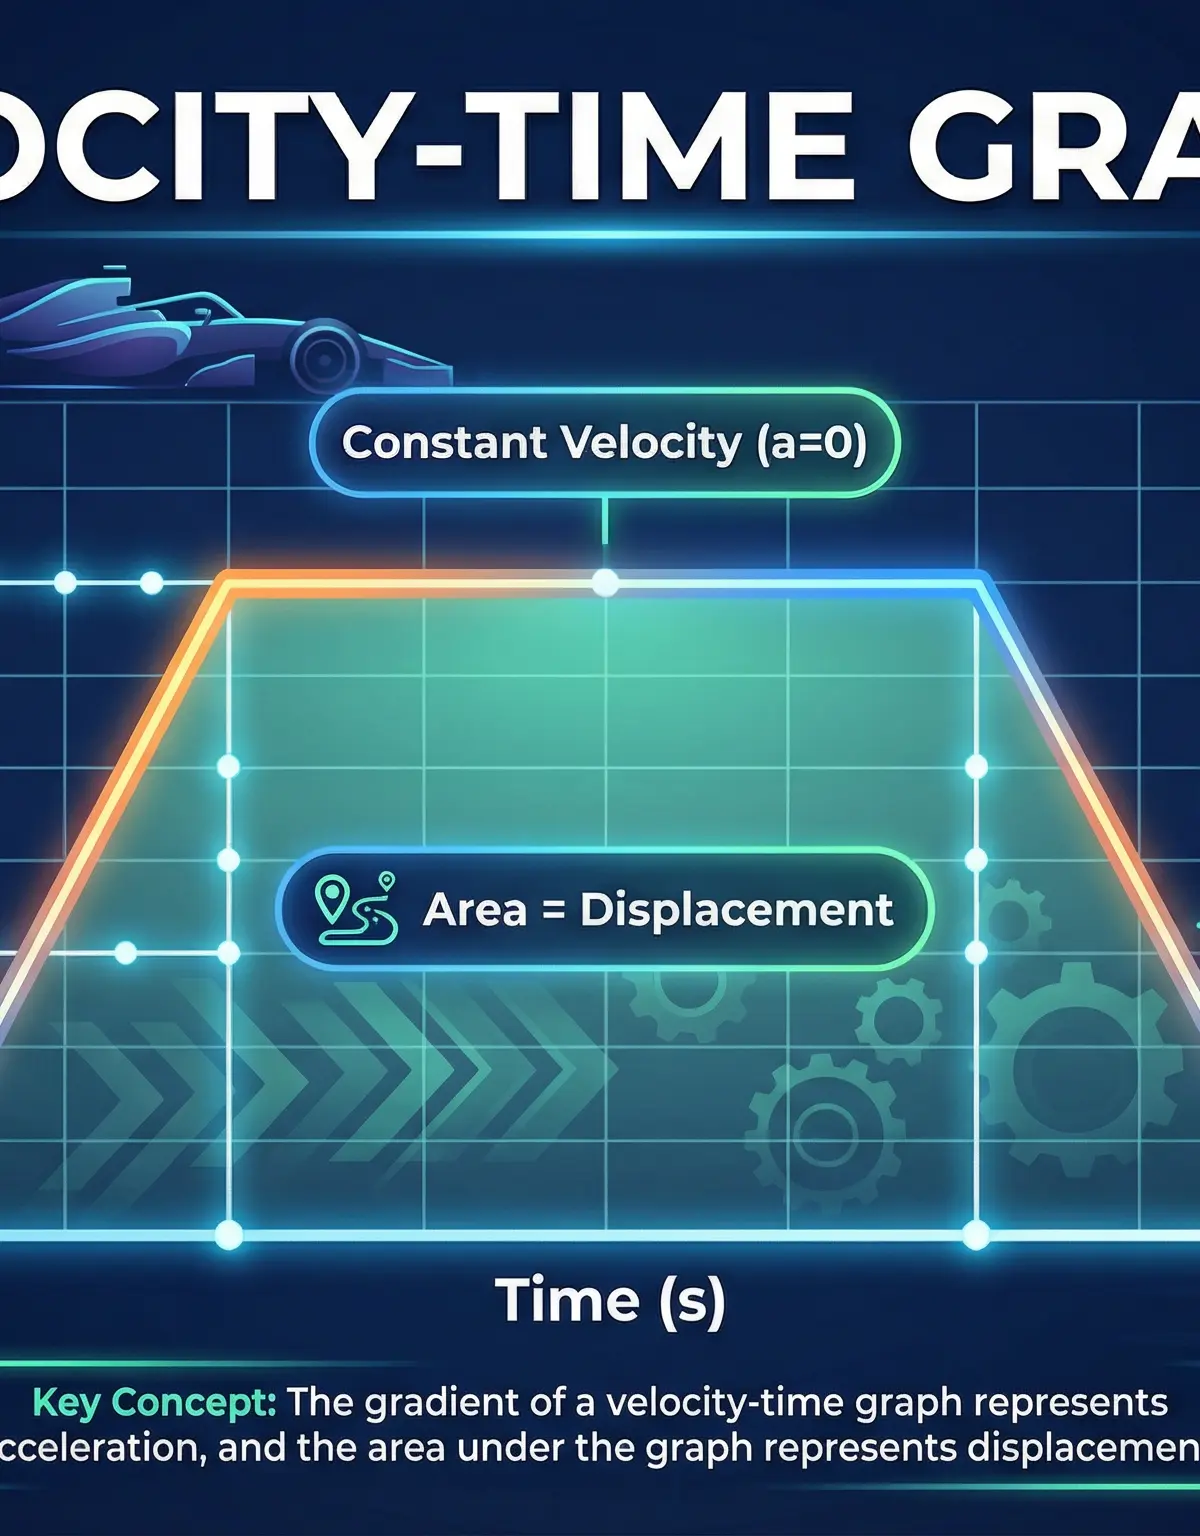
Velocity-time graphs are a cornerstone of kinematics in GCSE Physics, providing a powerful visual method to describe and analyse an object's motion. For an examiner, these graphs are an excellent way to test a candidate's ability to apply mathematical skills in a physics context (AO2), interpret data, and make logical deductions. This topic, specification reference 1.7, requires you to master two key skills: calculating acceleration from the gradient of the graph, and determining the displacement (or distance travelled) by calculating the area underneath it. Questions often involve multi-stage journeys, requiring you to break down the graph into distinct sections of constant velocity, constant acceleration, and deceleration. Higher Tier candidates face the additional challenge of interpreting curved graphs, which represent non-uniform acceleration, and must be able to use a tangent to estimate instantaneous acceleration. A solid understanding here provides a crucial foundation for more advanced mechanics in A-Level Physics.
Key Concepts
Concept 1: Interpreting the Axes and Gradient
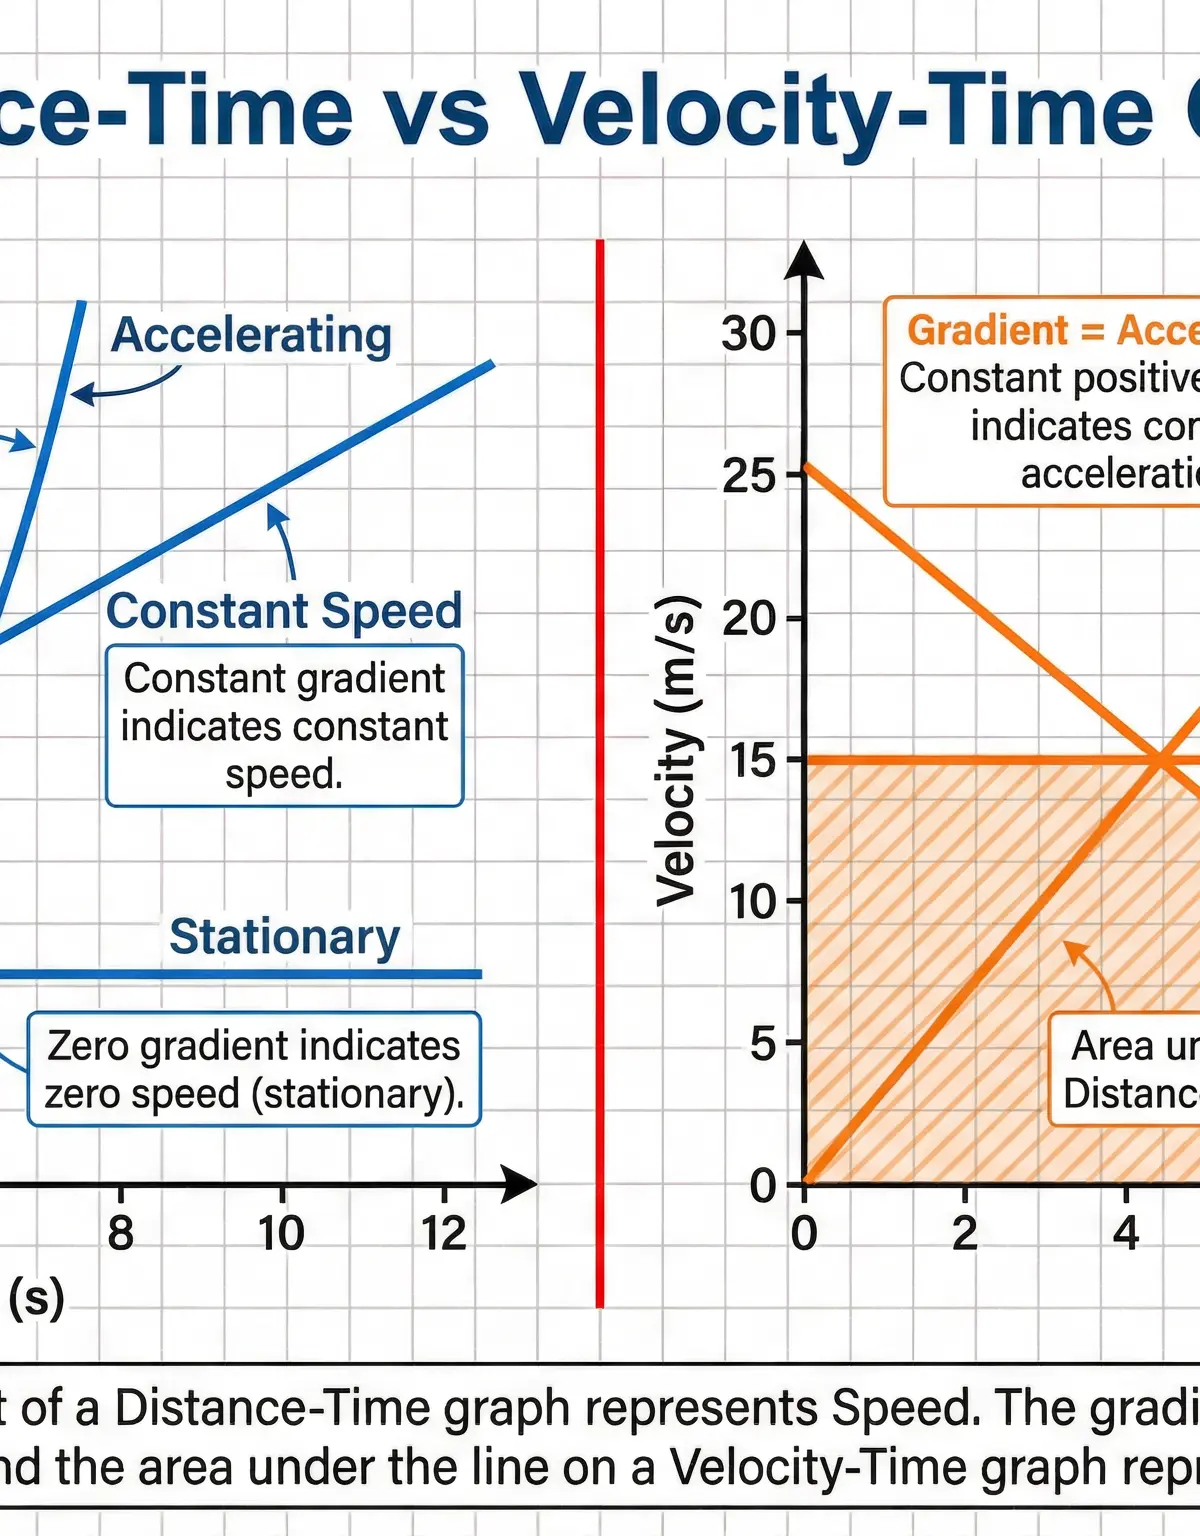
A velocity-time graph plots the velocity of an object on the vertical (y) axis against time on the horizontal (x) axis. The single most important skill is to understand that the gradient (steepness) of the line represents acceleration. A steeper line means a greater acceleration. A positive gradient indicates acceleration, a negative gradient indicates deceleration, and a zero gradient (a flat, horizontal line) means the acceleration is zero, which signifies constant velocity. This is the most common point of confusion; candidates frequently mistake a horizontal line for 'stationary'. An object is only stationary if the line is on the x-axis itself (where velocity = 0 m/s).
Example: If a line goes from (2s, 5m/s) to (7s, 20m/s), the gradient is the change in velocity (20 - 5 = 15 m/s) divided by the change in time (7 - 2 = 5 s). The acceleration is 15 / 5 = 3 m/s².
Concept 2: Calculating Displacement from Area
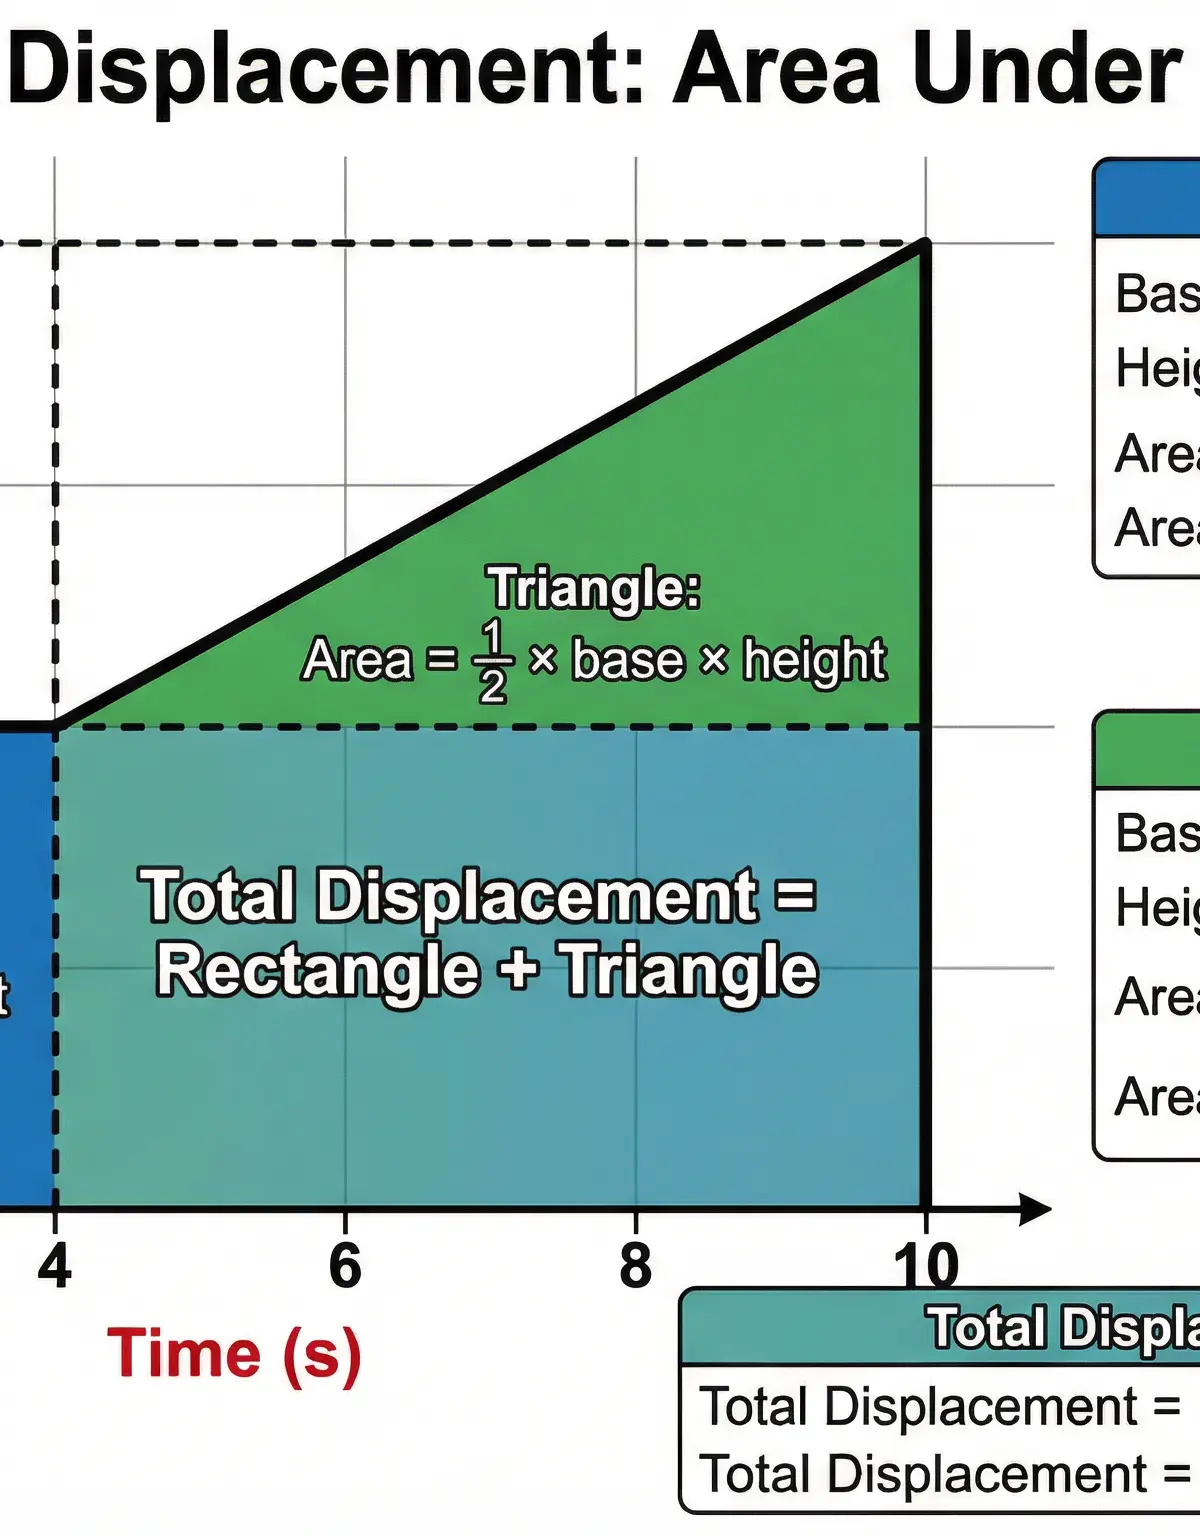
The second core skill is understanding that the area under the line on a velocity-time graph represents the displacement of the object (how far it has moved from its starting point). To find the total displacement for a journey, you must calculate the total area between the graph line and the x-axis. For any journey involving changes in acceleration, this often means the area is a composite shape. Candidates are expected to divide this area into simpler, standard geometric shapes—rectangles and triangles—to calculate the area of each part and then sum them. Credit is given for clearly showing how the area has been split.
Example: An object travels at a constant velocity of 10 m/s for 4 seconds. The area is a rectangle: Area = 10 m/s * 4 s = 40 m. If it then accelerates for 6 seconds, forming a triangle on top of the rectangle, you must calculate the area of that triangle (Area = ½ * base * height) and add it to the rectangle's area.
Concept 3: Non-Uniform Acceleration (Higher Tier Only)
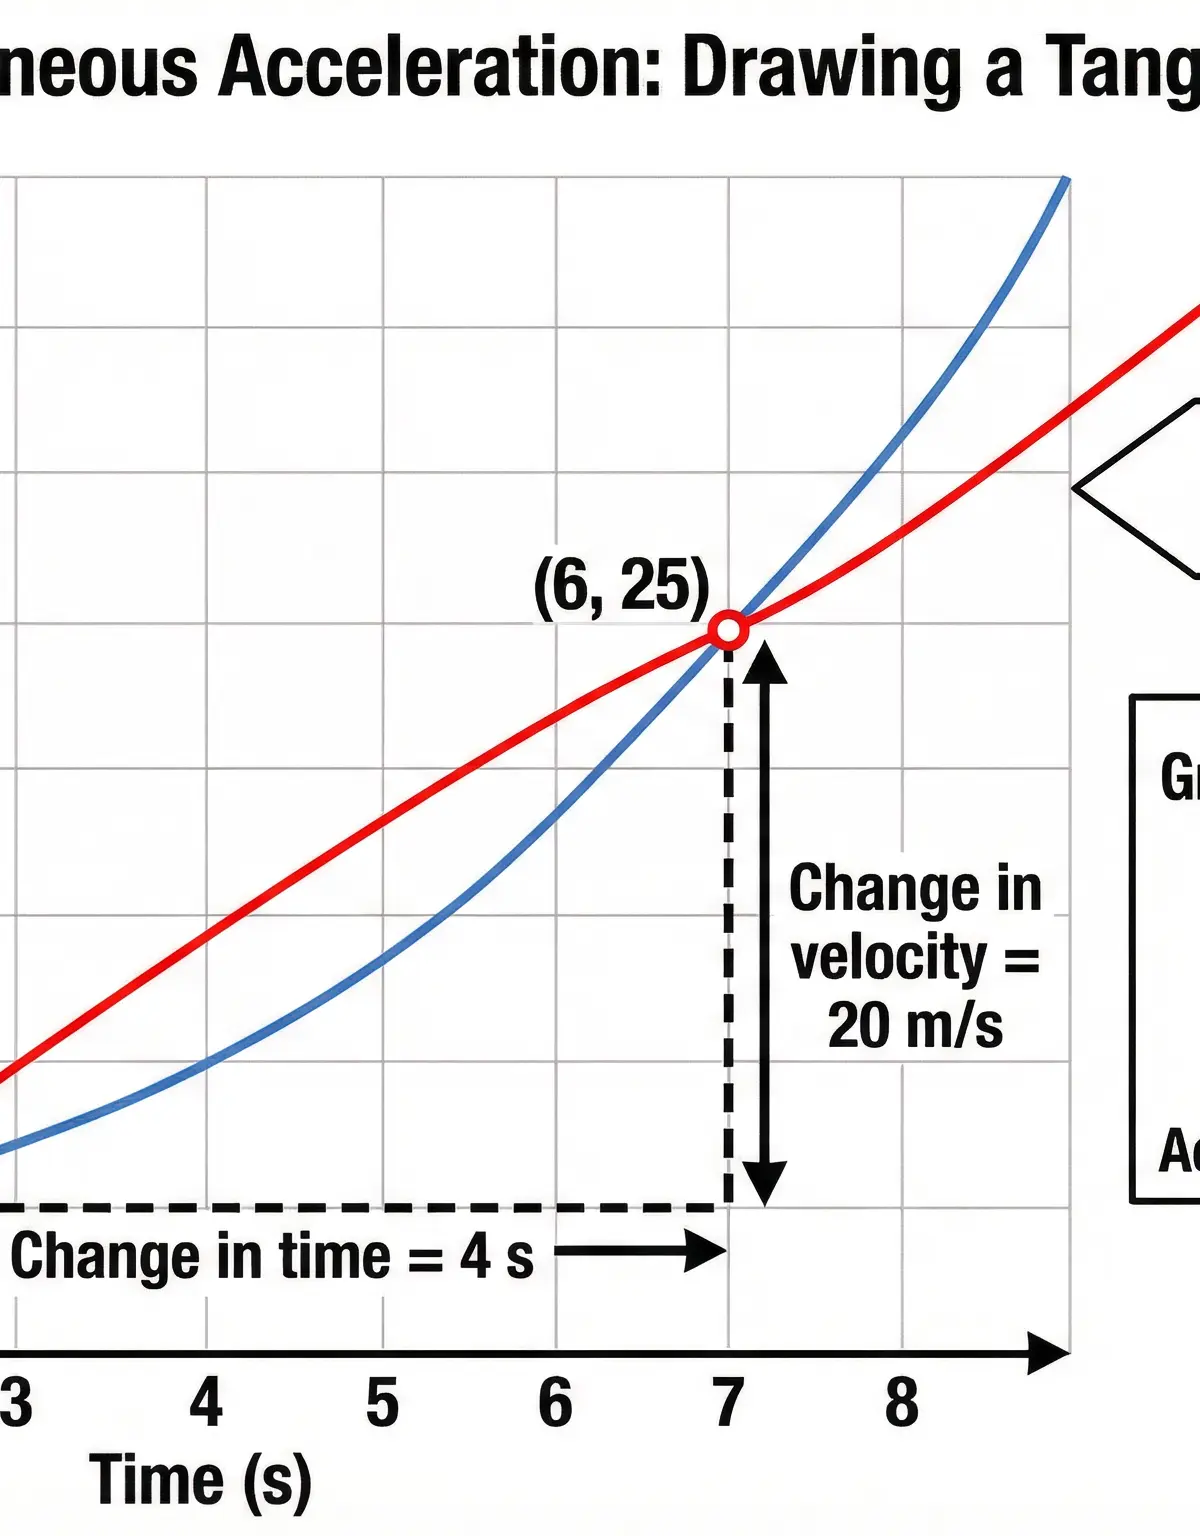
For Higher Tier candidates, the graph may not consist of straight lines. A curved line indicates that the acceleration is changing (it is non-uniform). You cannot calculate a single gradient for a curve. Instead, examiners will ask for the instantaneous acceleration at a specific point in time. To find this, you must draw a tangent to the curve at that exact point. A tangent is a straight line that just touches the curve at that point without crossing it. The gradient of this tangent is equal to the instantaneous acceleration at that moment. Marks are awarded for drawing a sufficiently long and accurate tangent and then correctly calculating its gradient.
Example: To find the acceleration at t = 4s on a curved graph, you would place a ruler on the graph, touching the curve at t=4s, and draw a straight line. You would then pick two points on this tangent line (as far apart as possible) and calculate the gradient as normal.
Mathematical/Scientific Relationships
-
Acceleration (from gradient): Must memorise.
a = (v - u) / tora = Δv / Δt
Where:a= acceleration (m/s²),v= final velocity (m/s),u= initial velocity (m/s),t= time taken (s),Δv= change in velocity. -
Displacement (from area of a rectangle): Must memorise.
Area = base × height(for constant velocity sections) -
Displacement (from area of a triangle): Must memorise.
Area = ½ × base × height(for sections of constant acceleration/deceleration from rest or to rest). -
Displacement (from area of a trapezium): Given on formula sheet, but often easier to split into a rectangle and triangle.
Area = ½(a+b)hwhereaandbare the parallel sides (the initial and final velocities) andhis the width (the time interval).
Practical Applications
While there isn't a specific required practical for velocity-time graphs, the principles are fundamental to analysing motion in all dynamics experiments. For example, if you were investigating the motion of a trolley rolling down a ramp, you could use a motion sensor connected to a data logger to plot a real-time velocity-time graph. The graph would likely be a straight line through the origin, showing constant acceleration due to gravity. You could then calculate the gradient to find the experimental value for the trolley's acceleration. This links directly to investigations of Newton's Second Law (F=ma).
Visual Resources
3 diagrams and illustrations


Interactive Diagrams
2 interactive diagrams to visualise key concepts
Conceptual Flow Outline
A flowchart showing the decision-making process for tackling any velocity-time graph question.
Conceptual Flow Outline
Concept map comparing the meaning of different line shapes on Distance-Time vs. Velocity-Time graphs.
Worked Examples
3 worked examples — open one to explore the question and available guidance.
Practice Questions
Try the question, then reveal an answer plan or example response
A sprinter runs a 100m race. The graph shows their velocity for the first 4 seconds. Describe the motion of the sprinter. [2 marks]
Hint: Look at the shape of the line. Is it straight or curved? What does this mean for the acceleration?
The graph shows a train journey between two stations. Calculate the acceleration in the first 20 seconds. [3 marks]
Hint: Acceleration is the gradient. Find the change in velocity and divide by the change in time for the first section.
For the train journey shown in the graph, calculate the total distance travelled. [4 marks]
Hint: The total distance is the total area under the graph. Split it into a triangle and a rectangle.
Compare the motion of the object in section A (0-10s) with the motion in section C (25-30s). [4 marks]
Hint: Compare means you need to state similarities and differences. Discuss acceleration and direction of motion.
(Higher Tier) For the sprinter graph, a student states 'The acceleration at 2s is greater than the acceleration at 4s'. Explain whether you agree with this statement. [3 marks]
Hint: On a curved V-T graph, how is acceleration represented? How does the steepness of the graph change?
Exam technique
How to turn what you know into marks
How to approach the question
1. Immediately check the y-axis label: is it 'Velocity' or 'Distance'? This is the most critical first step. 2. Read the question carefully and highlight the command word (e.g., Calculate, Describe, Estimate) and the specific time interval you need to consider. 3. For 'Calculate distance', draw vertical lines on the graph to split the area into shapes. For 'Calculate acceleration', identify the start and end points of the relevant straight-line section.
How to structure your answer
For calculation questions: 1. Write the formula. 2. Show substitution of values from the graph. 3. Give the final answer with units. For 'Describe' questions, use phrases like 'constant acceleration from...to...', 'constant velocity of...', and 'decelerates to rest', quoting values from the axes.
Timing
Approximately 1 minute per mark. A 5-mark question on this topic should be completed in around 5-6 minutes, leaving time to check your work.
Common pitfalls
- Confusing a horizontal line on a V-T graph with 'stationary'. It means constant velocity. Always check the y-axis label first!
- Forgetting to multiply by ½ when calculating the area of a triangular section. This will double your calculated distance for that portion of the journey.
- Using the wrong time interval for a calculation. If asked for acceleration between 2s and 5s, the change in time is 3s, not 5s.
- Stating that a negative gradient means 'moving backwards'. It means deceleration (slowing down). The object only moves backwards if the velocity itself is negative (the line is below the x-axis).
What the command words want
- Compare
- For two sections of a graph, state what is similar AND what is different. E.g., 'Both sections show constant acceleration, but the acceleration in section A is greater than in section B.'
- Explain
- Use cause and effect. 'The gradient is zero, which means the rate of change of velocity is zero, THEREFORE the acceleration is zero.'
- Describe
- Provide a narrative of what the graph shows. Use values from the axes to tell the story of the motion.
- Evaluate
- Not common for this topic, but would involve weighing evidence, e.g., from two different graphs of car performance.
- Calculate
- Show all steps: Formula -> Substitution -> Answer -> Units.
- State/Give
- A concise, factual answer. Often a single value or term.
Watch or listen (optional)
Test your understanding of Velocity-time graphs
Active recall beats re-reading. Take an instant quiz now to test what you’ve learned and lock it into long-term memory.
A week of Premium from your first lesson · Then the free plan continues · No card, no charge