Lab Report Writing: Top Marks at GCSE and A-Level

Most advice on lab report writing starts in the wrong place. It tells you to follow a neat university template, then buries the point that actually matters in UK schools, examiners reward scientific thinking, not just tidy formatting. A report can still score highly even if the experiment went wrong, as long as the writing shows clear method, honest data handling, and solid evaluation rooted in what the results mean.

That matters because UK guidance treats lab reports as evidence-based documents with explicit sections, not just a story of what happened. Sheffield's lab-report guidance expects an abstract, a point-by-point method, clear results, a discussion, and references, while also stressing that important data should be shown visually and statistical results should use the right conventions for the subject (University of Sheffield lab report guidance). In plain terms, teachers want to see units, figures, tables, and statistical outputs, not paragraphs of vague description.
Why a Failed Experiment Can Still Earn Top Marks
Students often assume the mark is attached to a perfect outcome. In UK science writing, the marks usually go to the quality of your thinking. A practical can go wrong and still score well if the report shows why the result turned out that way, what limited it, and how the conclusion follows from the evidence.
What examiners reward instead of perfection
In school science, the Results section should report data, not explain it. Good reporting keeps the facts in one place and the interpretation in another, so the marker can see exactly what you measured and what you made of it. The University of Southampton statistics guide makes that split clear, since results should include descriptive statistics such as the mean and standard deviation, plus the test statistic, degrees of freedom, and p-value, while key outputs should be reported without interpretation. That kind of separation matters because it shows you can treat evidence carefully, which is exactly what mark schemes reward.
Practical rule: if a sentence starts explaining why the result happened, it belongs in analysis or evaluation, not in results.
That is why a “bad” result can still earn high marks. If your data did not match the textbook pattern, the examiner still wants precise reporting, a sensible conclusion, and an evaluation that points to likely causes rather than excuses. Many students lose marks by sounding defensive instead of analytical, even when their practical work was soundly carried out.
School reports are not the same as university templates
A lot of online advice pushes full IMRAD writing, with literature reviews and heavyweight academic framing. That level of structure is often more than GCSE and A-Level practical write-ups need. UK classroom science usually expects a tighter layout, one that focuses on the aim, method, results, analysis, conclusion, and evaluation, without padding.
The method section should read as a chronological record of what you did, with enough detail for someone else to repeat it, including the design, sample size, repeats, and how you took measurements (Trent University methods guidance). MIT's lab-report guidance makes the same split very clearly, methods describe the experiment, results contain the data and calculations (MIT scientific-writing guidance).
If you want a report that reads like a top-band answer, write like someone who understands the experiment, not someone copying a worksheet. That shift in tone is often what turns messy practical work into strong marks.
Structuring Your Lab Report for Maximum Clarity
A report is easier to mark when each section does one clear job. In UK science marking, that usually means the reader can separate what you planned, what you did, what you found, and what you can justify from the evidence. If those boundaries are blurred, marks tend to disappear into vague writing rather than poor practical work.
Start with the aim and method
Your aim should be short, specific, and tied to the hypothesis or research question. A good version normally names the variable you changed and the variable you measured, without turning into a paragraph of background. If your course requires an abstract, the McGill Library lab report guidance says it should usually be no more than 200 to 250 words, and it should briefly cover the hypothesis or reason for the experiment, the method and materials, the results, and the main conclusions.
The method needs precision, but not waffle. Write it as a chronological account of what you did, and include only the details needed for replication. That means the equipment, measurements, repeats, timing, and setup, not long chunks copied from the worksheet. A simple test helps here. If someone else could not repeat the practical from your method, it is too vague.
Keep results clean and separate
The Results section should contain data, calculations, and observations, but no interpretation. UK guidance on reporting statistics draws the same line, and school science marking usually does too. If you write, “the temperature increased because the reaction was exothermic,” that belongs in analysis, not results (University of Southampton statistics guide).
A neat title helps as well. Phoenix College title guidance advises that a lab report title should be a brief summary of the main ideas and should be between 5 and 12 words long. Keep it informative, not flashy.
A report gets easier to mark when every section has a clear border. Once the border disappears, marks often do too.
Use the abstract only if it is required
If your course asks for an abstract, keep it short and focused. Do not cram in background theory or long explanations. The McGill guidance is useful because it gives students a concrete word range and content list, which stops the abstract from becoming a mini essay (McGill Library lab report guidance).
For students who want to compare their marking approach with exam board specific marking with AI, the useful habit is to check whether each section matches its job before polishing the wording. That is how you stop a decent practical from being dragged down by structure.
Presenting Data and Uncertainty Like a Scientist
Many students give away easy marks here. The data is present, but the table is untidy, the graph does not match the variable, or the units disappear partway through. Good presentation makes your thinking visible, and examiners can only reward what they can clearly see.
Build results tables that do the heavy lifting
A results table should be clean, labelled, and include units where needed. If you are recording measurements, keep the layout simple and consistent so the reader can spot patterns without hunting across the page. Use metric units in the body of the report, and write numbers below one with a leading zero, such as 0.2, not .2 (formal lab-report formatting guide).
Tables also need to earn their place. A well-built table helps the examiner follow your method, compare repeats, and see whether the values move in the direction you expected. If the layout makes the data hard to scan, you lose marks even when the measurements themselves are sound.
For school science, the right graph depends on the data. Use a line graph for a continuous independent variable, a scatter plot when you are looking for correlation, and a bar chart for separate categories. The point is choice, not decoration. The display should match the type of variable in front of you.
| Independent Variable | Dependent Variable | Best Graph Type | Example |
|---|---|---|---|
| Continuous | Continuous | Line graph | Temperature and reaction rate |
| Continuous | Continuous | Scatter plot | Mass and extension |
| Categories | Measured value | Bar chart | Different materials and conductivity |
A graph with the wrong scale, missing labels, or awkward plotting tells the marker that you did not control the presentation. That is like handing in a ruler with no marks and expecting full credit for precision.
Report uncertainty without panic
Uncertainty is not a sign that your experiment failed. It shows that you understand measurement. A balance, thermometer, stopwatch, or measuring cylinder all have limits, and those limits matter because they affect how confident you can be in the result. Even the choice of apparatus changes how reliable a reading is, which is why a glass vs plastic graduated cylinder can be a useful comparison when you are thinking about precision in a real lab.
If your teacher expects statistics, report them properly. The key items named in UK guidance are the mean, standard deviation, the test statistic, degrees of freedom, and the p-value (University of Southampton statistics guide). Do not scatter those numbers through the paragraph and hope they make sense. Put them where they belong, then refer to them directly so the reader can follow your reasoning.
That same discipline applies if you are checking your structure against exam board specific marking with AI. The mark is usually won by placing the right information in the right place, not by dressing it up with extra wording.
Handle anomalies with judgement
An anomalous result is not automatically useless. Sometimes it should be excluded, but only if you can justify that decision using the method, the spread of the data, or a clear procedural issue. If you leave it in, explain how it affects the trend. If you remove it, say why. That is the difference between pretending and analysing.
Markers usually respond well to calm, specific judgement. A strong report does not panic when one reading disagrees with the rest. It shows whether the odd result is likely to come from human error, equipment limits, or a flaw in the method, then uses that evidence to support the conclusion.
For students who want a practical comparison point for how subject demands shift between stages, chemistry alevel gcse help can be a useful reference. It is a reminder that the same lab report skill can be judged differently depending on the course, so the safest approach is to match the detail to the mark scheme in front of you.
Subject Specific Tips for Biology Chemistry and Physics
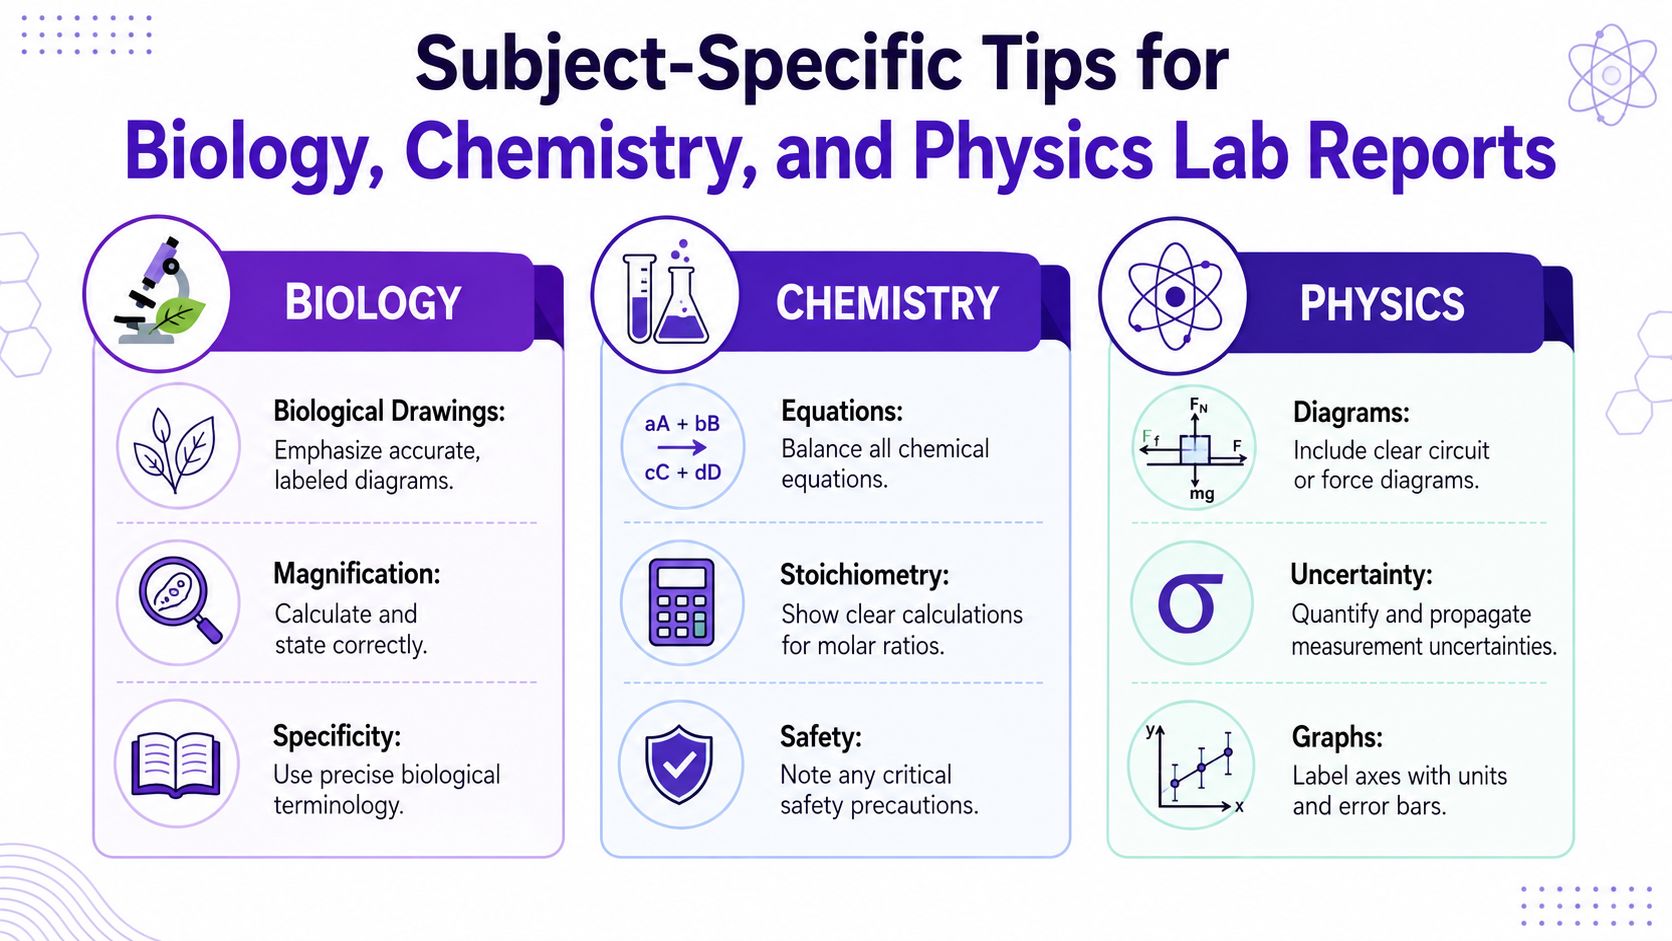
The overall structure of a lab report stays similar, but each science has its own pressure points. That's where lots of marks slip away. A biology report that ignores biological detail, a chemistry report that skips equations, or a physics report that blurs the calculations will all feel unfinished to the examiner.
Biology needs precision with living systems
Biology practicals often live or die on control. Living material varies, so your method and evaluation need to show that you noticed the variables that could change the outcome. Accurate biological terminology matters too, because vague labels make even a decent practical look weak.
Biological drawings and magnification calculations are another common trap. If the task involves microscopy, label carefully and make sure your magnification is stated correctly. Sloppy diagrams are easy to spot, and they usually cost marks because they suggest careless observation rather than careful science.
Chemistry needs clean numerical reporting
Chemistry write-ups often involve titrations, equations, and careful measurement. Balanced equations should sit alongside your data where they help the reader understand the reaction, not hidden in a throwaway line. If you're reporting titration work, keep the burette readings clear and show the calculation route properly.
Safety can matter in chemistry more than in the other sciences, because the practical choices affect both the result and the risk. If you changed the method because of a hazard, say so. That kind of detail helps the examiner see that you understood the practical, not just the answer.
Physics needs calculations to be legible
Physics rewards clean derivations and sensible handling of uncertainty. If a calculation feeds into a gradient, an extension, or a force relationship, show enough working for the examiner to follow the logic. A physics report that jumps straight to an answer without the working often looks unfinished, even if the number is right.
Graphs matter especially here. Axes need units, and error bars should be used where they are part of the expected presentation. If your analysis depends on gradient, make sure the line is drawn and interpreted properly rather than treated like a throwaway graph task.
For students moving between disciplines, bacterial DNA and infection risks can be a useful reminder that biology write-ups often need sharper terminology and a stronger link between observation and explanation than chemistry or physics.
Turning Messy Results Into Strong Evaluation Marks
Evaluation is where many students lose marks by being too vague or by writing a list of flaws with no explanation. The stronger answer does three things in order. It names the limitation, shows how that limitation affected the results, and then gives an improvement that would change the quality of the next attempt. That is the sort of thinking examiners reward.
A weak evaluation often sounds safe but says very little. A line like “the experiment could be improved by using more accurate equipment” may be true, but it stays at the surface. It does not identify which part of the setup caused the problem, what the problem did to the data, or why the new method would help.
The University of Toronto's lab-report guidance makes a useful distinction here. Writing support often explains how to describe errors and unexpected outcomes, but students still have to turn that raw material into a proper discussion rather than a list of complaints (University of Toronto lab report guidance). That matters in school marking because a strong evaluation sounds like reasoning, not apology.
What a strong evaluation sounds like
A stronger evaluation stays close to the evidence. If repeats varied because the timing method was inconsistent, say that this reduces reliability, then explain whether a stopwatch, a clearer start signal, or a longer observation period would reduce the spread. If the temperature drifted during the practical, explain how that could shift the dependent variable and weaken validity.
A simple marking rule helps here. Name the limitation, explain its effect on the result, then show how the improvement changes the science. That is the kind of chain examiners can follow without guessing what you meant.
If you are trying to judge whether your evaluation is analytical enough, see MasteryMind NEA Coach can help you check the quality of your explanation without writing it for you.
How to write about failure without sounding defeated
A failed experiment can still earn strong evaluation marks if you keep the explanation causal. If the result did not match the hypothesis, decide whether the issue came from measurement, control of variables, the method itself, or the nature of the practical. Then say whether the data still supports a partial conclusion.
That last part matters more than many students expect. Examiners do not usually want a dramatic verdict. They want to see whether you can separate a flawed result from a useless one, then explain what the result still shows. A messy practical can still demonstrate understanding if your evaluation shows where the weakness came from and what would need to change next time.
Your Pre Submission Checklist and Common Mistakes
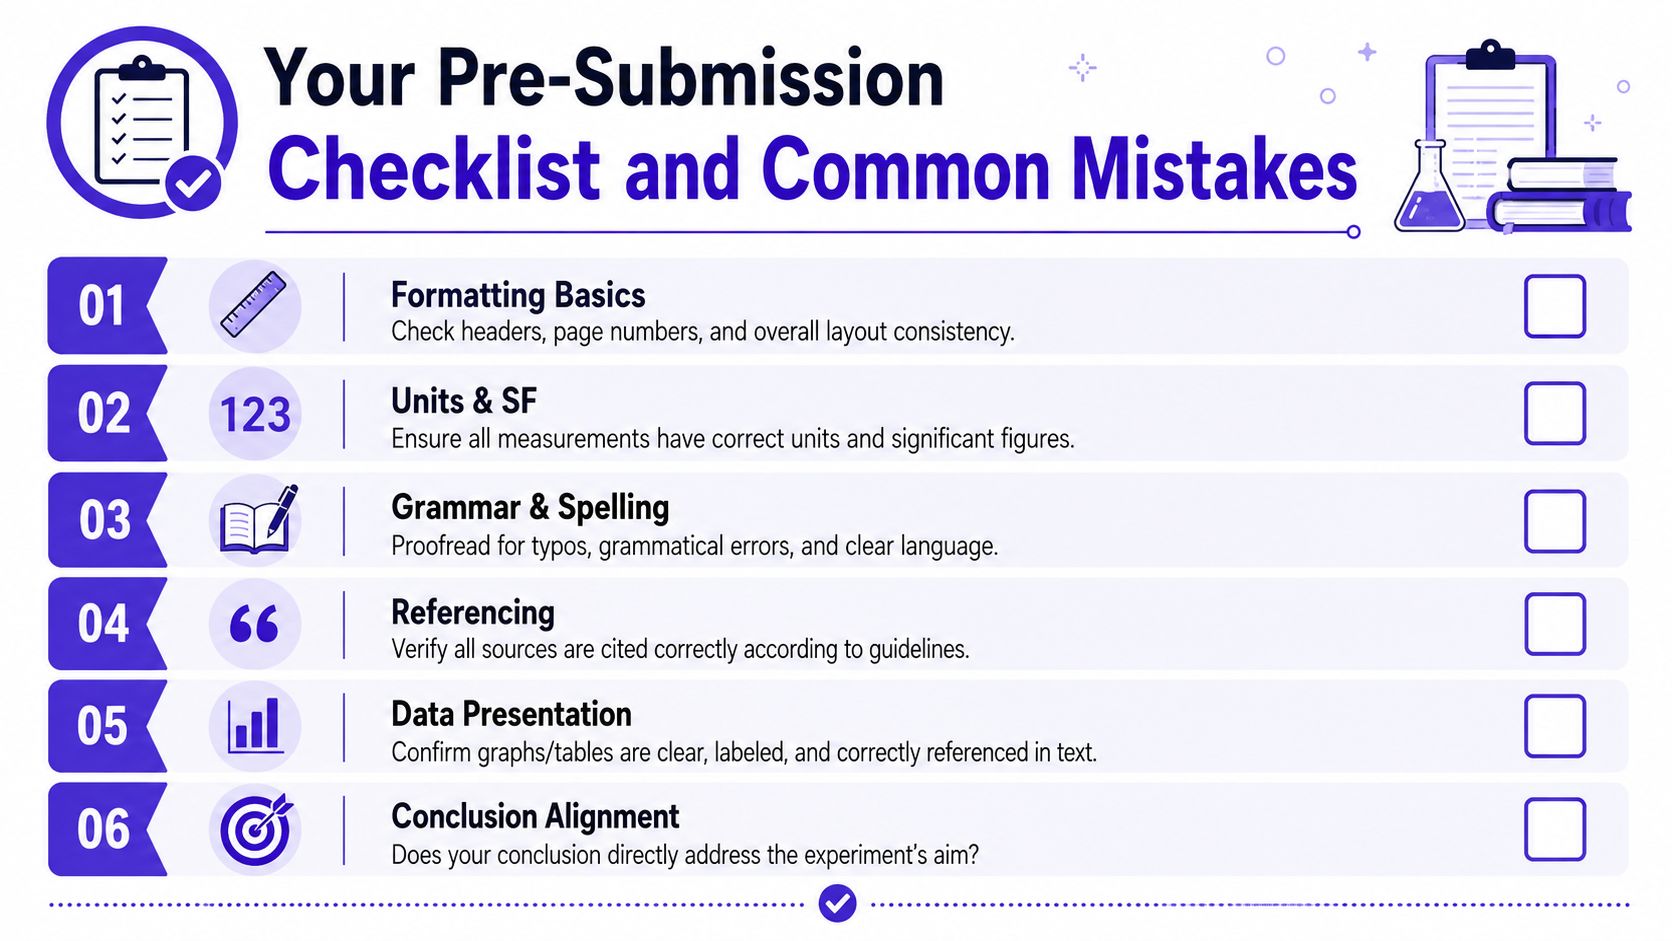
A strong lab report often loses marks at the final check, not because the science is weak, but because a small detail gets missed. A unit is left off, a graph cannot be read, or the conclusion drifts away from the aim. That is the sort of thing examiners notice quickly, because they are marking for clear communication as well as scientific understanding.
Final checks that catch easy mistakes
- Units and significant figures: Every measurement should carry the correct unit, and your rounding should stay consistent throughout the report.
- Leading zeros: Write 0.3, not .3.
- Graphs and tables: Label every axis clearly, and include units on each one.
- Conclusion match: Your conclusion should answer the original aim directly, without drifting into a new claim.
- Section separation: Keep method, results, analysis, and evaluation separate so the examiner can find each part quickly.
Presentation still matters because it helps the examiner read your science efficiently. A formal lab report guide may ask for work to be typed, double-spaced, with 1.0 inch margins, and for measurements to be in metric units. Those are simple requirements, but they make the report easier to check and show that you have treated it as assessed work rather than a rough note.
The most common mistakes to fix fast
Copying the method straight from the worksheet is one of the quickest ways to weaken a report. Put it into your own words and keep the steps in order, so the reader can follow what was done without having to decode a handout. Blending results and analysis into one paragraph causes a different problem, because the evidence and the explanation become harder to mark separately.
If your graph is accurate but the writing ignores it, that is another common loss of marks. Point to the trend, state what it shows, and connect it to the aim. If you cannot explain the graph in one clear sentence, the examiner is unlikely to reward the explanation fully.
A failed experiment can still score well if the final comments are honest and precise. Say whether the weakness came from measurement, control of variables, the method, or the practical itself, then explain what the result still allows you to conclude. That approach matches what exam boards reward, and it is the same sort of disciplined checking used in Exam Practice for A-Level, where students learn to work under pressure without drifting off task.
Use the checklist before you hand anything in. Read for units, layout, labels, conclusion, and whether each section does its own job. That final pass often turns a scrappy draft into a report that is easier to mark and more likely to pick up the marks it already deserves.
Ready to master this topic?
Practise with quizzes, blurt exercises and exam questions on MasteryMind.
7 days Premium · Then free forever · No card, no charge