What Are Quadrats: A 2026 Guide to Ecology Fieldwork

You're probably here for one of two reasons. Either you've got an ecology practical coming up and everyone keeps saying “quadrat” like it's obvious, or you've turned over an exam paper and found one of those plant distribution questions that can wreck a whole page of marks if you panic.
The good news is that quadrats are much simpler than they first sound. They're one of those topics that feels awkward until someone explains what's happening in the field, what the data means, and what examiners want written down. Once that clicks, the method becomes very learnable.
That Dreaded Fieldwork Question
A student sits in the exam hall, gets to the six-marker, and sees: Describe how you would investigate the distribution of plants in a grassland habitat. At that point, a lot of students remember a square frame, a school field, and not much else.
That's normal. Quadrat questions often expose a gap between recognising a keyword and understanding its application. That gap matters. A 2025 UK Land Trust report found that 68% of post-16 fieldwork submissions from UK schools used fewer than 30 quadrats, resulting in underestimated species density with a mean error of 22% compared to 100-quadrat benchmarks (questions about quadrats on SAPS).
Teachers will spot the same pattern straight away. Students often know the word random but place the quadrat wherever it looks convenient. They can define percentage cover but then forget how a gridded frame helps them estimate it. They can talk about distribution, but not explain how the sampling method reduces bias.
What usually goes wrong
- Panic replaces method. Students jump to counting plants without describing how the sample area was chosen.
- Key terms blur together. Frequency, density, and percentage cover get mixed up.
- Fieldwork and exam writing feel separate. In reality, they're the same skill in two formats.
Straight truth: quadrat questions are very scoreable once you know the sequence and the wording examiners expect.
If you're revising with tools like AI Powered Revision, this is exactly the sort of topic worth tightening up early. A clear practical method can help achieve marks in biology and in any evaluation question linked to ecology.
What Are Quadrats and Why Do We Use Them
A quadrat is a simple frame, usually square, made from metal or plastic. You place it on the ground and study whatever is inside it, usually plants or slow-moving organisms.
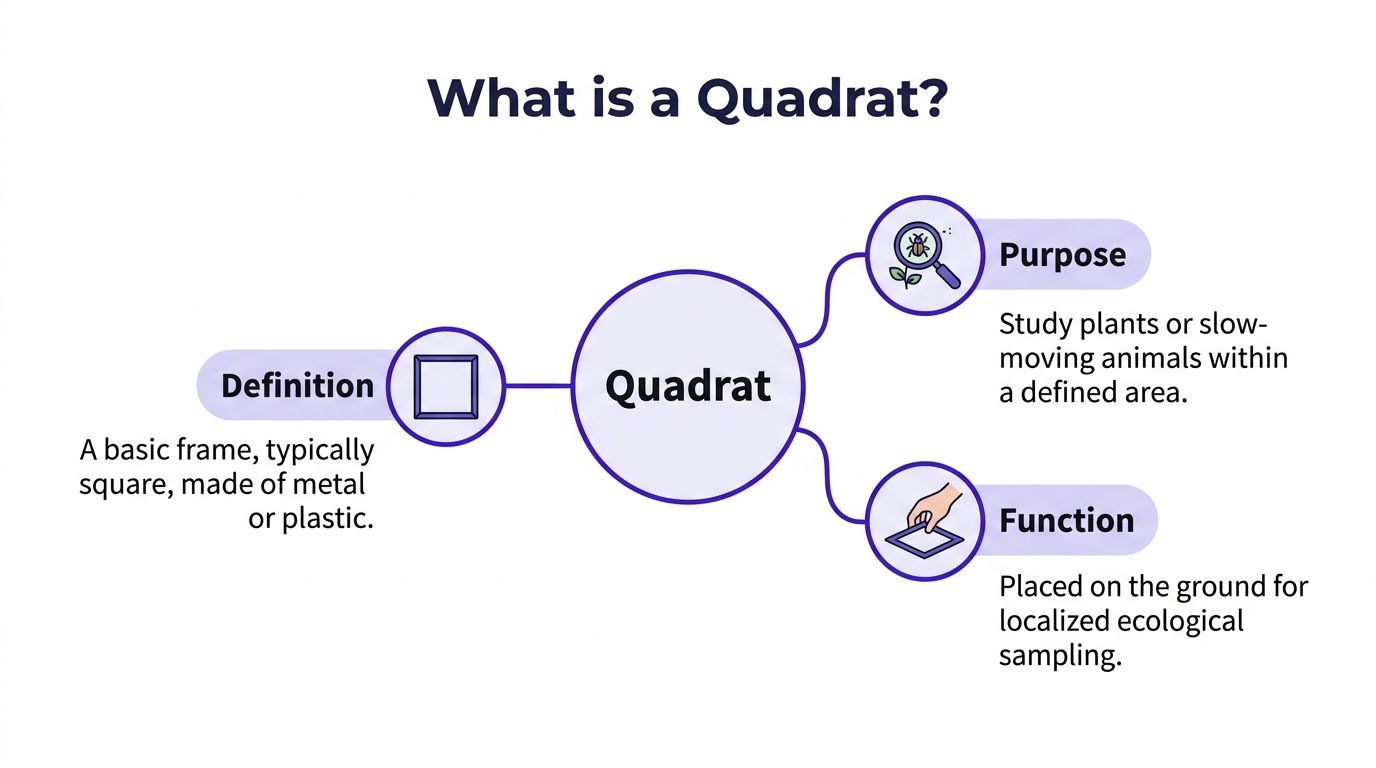
If that sounds too basic, that's because it is basic. And that's the point. Ecologists need a practical way to sample a habitat without digging up the entire area or counting every blade of grass by hand.
The cake-slice analogy
If you wanted to know what a huge cake was like inside, you wouldn't eat the whole thing first. You'd take a slice and use that sample to judge the layers and proportions. A quadrat does the same job for a habitat.
You sample a small, defined area. Then you use that sample to make sensible conclusions about the larger area.
That's why the answer to what are quadrats isn't just “square frames”. They are sampling tools. They help biologists study:
- Abundance, meaning how much of a species is present
- Density, meaning how many individuals are in a given area
- Distribution, meaning how organisms are spread out
Why ecologists rely on them
Quadrats are used widely because they're simple to carry, simple to place, and non-destructive. In UK fieldwork, common quadrat sizes include 1 m × 1 m and 2 m × 2 m, while the most frequent standard size for general vegetation sampling taught in GCSE and A-Level practicals is the 50 cm × 50 cm (0.25 m²) frame quadrat, often split into 100 squares of 5 cm × 5 cm for local frequency and percentage cover work (vegetation patch structure method).
That one sentence explains a lot of school biology. If your teacher brings out a square frame with a grid, that isn't random equipment. It's the standard tool for studying vegetation in a manageable, repeatable way.
Why this matters in exams
Examiners aren't only checking if you know the definition. They want to know if you understand the reason for using one. A strong answer usually links the quadrat to:
- a defined sample area
- a fair method
- a repeatable process
- data that can be compared
For board-specific biology practice, MasteryMind AQA Edexcel Biology is the kind of revision setup that helps students see how the practical method turns into an exam answer, rather than leaving it as a vague memory from fieldwork day.
Choosing Your Tools and Sampling Strategy
Picking up a quadrat is not the first decision. The first decision is how you're going to sample the habitat fairly.
The frame most students use
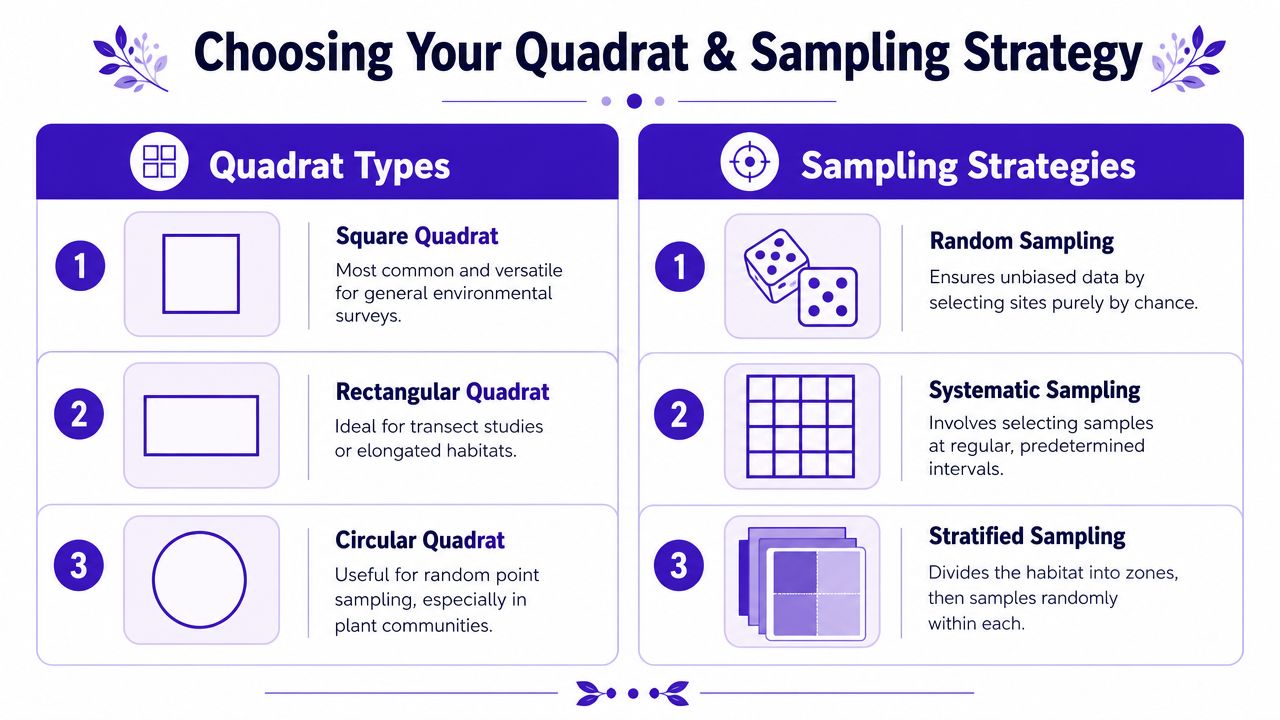
For school fieldwork, the usual choice is the 50 cm × 50 cm (0.25 m²) quadrat, often divided into 100 small squares of 5 cm × 5 cm. That grid helps you estimate cover much more precisely because each little square gives you a tiny visible unit to work from.
A plain frame can still work, but a gridded one makes life easier when the habitat is full of grasses, mosses, or mixed vegetation where counting individual plants would be messy.
Three sampling strategies compared
The frame matters. The placement matters more.
| Strategy | Best used when | Main strength | Main risk |
|---|---|---|---|
| Random sampling | Habitat is fairly uniform | Reduces bias | Can miss patterns across gradients |
| Systematic sampling | You want to track change across space | Good for trends along a transect | Can be less representative if patterning matches interval |
| Stratified sampling | Habitat has clear zones | Represents each zone fairly | Needs careful planning |
Random sampling
Random sampling works well in places like a field that looks fairly similar across the whole area. You mark out the site, generate coordinates, and place the quadrat where the numbers tell you.
That stops you choosing “nice-looking” patches. Students often do that without noticing, and it skews the data.
Systematic sampling
Systematic sampling is brilliant when conditions change across a habitat. You might place quadrats at regular intervals along a transect from a path into longer grass, or from dry ground into damper soil.
That gives you a clean pattern to analyse. If the question is about how species change with distance, this is often the strongest choice.
Stratified sampling
Some habitats have obvious sections, such as sunny and shaded areas, or rough grass next to scrub. Stratified sampling means you divide the site into those sections and sample within each one.
That way, one part of the habitat doesn't dominate the results because it's easier to access or more obvious.
Practical rule: choose the sampling method to match the habitat, not the one you remember first.
Environmental conditions also shape what you see inside the quadrat. If you're trying to understand why growth differs between patches, factors like soil water can matter, and a plain-language explainer on optimal substrate moisture levels is useful background for thinking about how moisture affects plant communities.
For students who also study ecosystems more broadly, MasteryMind Environmental Science is a useful route into the bigger picture behind these methods.
Your Step-by-Step Fieldwork Guide
When students lose marks on quadrat fieldwork, it's rarely because the method is hard. It's usually because they skip a step, rush the placement, or record data inconsistently.
Before the quadrat even hits the ground
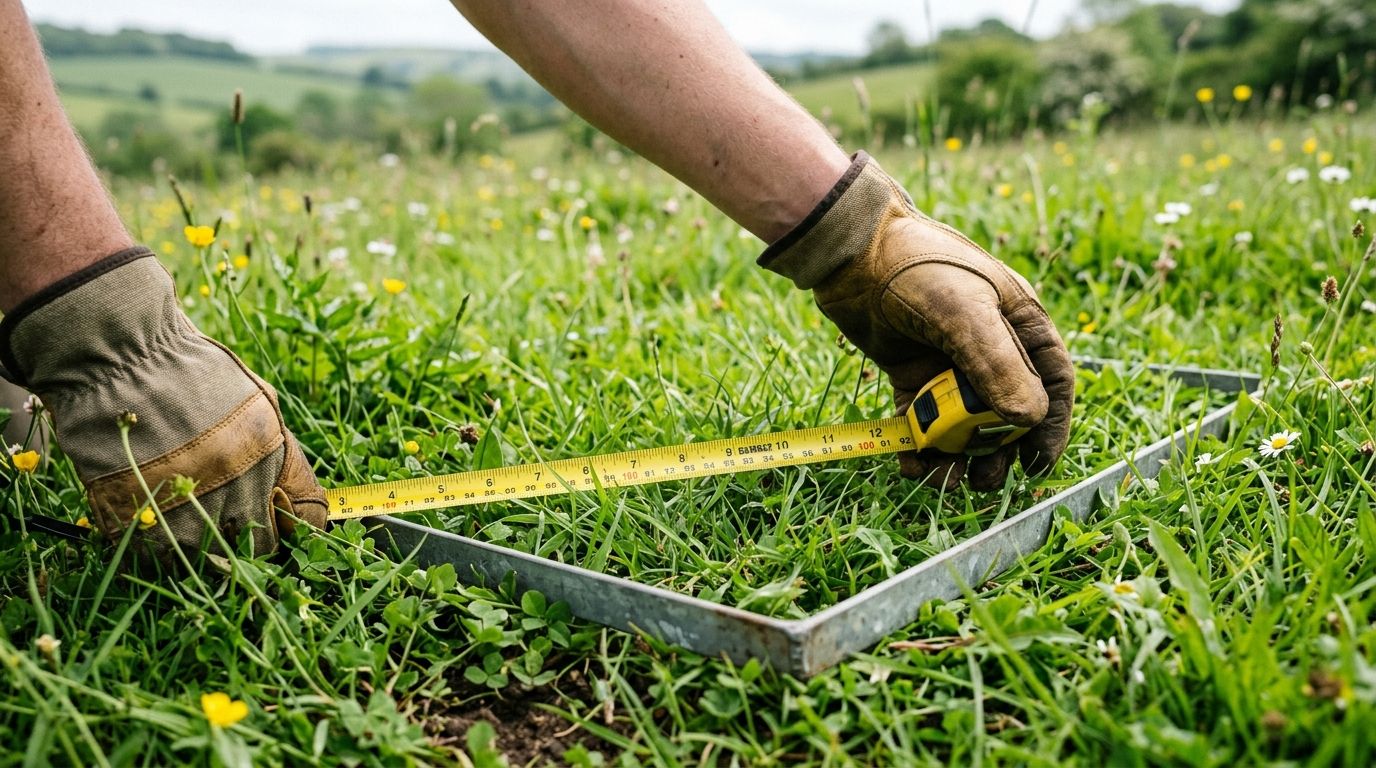
Start by marking the study area clearly. Tape measures are your friend here. If you're doing random sampling, they let you create axes so you can use coordinates properly. If you're doing systematic sampling, they help you keep intervals even.
Then set up the sampling method before you start counting anything. Don't decide where the quadrat goes by eye.
The field method in order
Mark out the sample area
Define the habitat boundary first so every quadrat comes from the same study zone.Choose the location scientifically
Use random coordinates, a transect, or zones for stratified sampling. The placement rule must be consistent.Place the quadrat gently
Lay it flat on the ground. Don't shove it down into the vegetation.Identify what's inside
Record the species present. If you're unsure, use a key and stay cautious rather than guessing.Apply your edge rule
Plants on the border can cause arguments. Pick a rule and stick to it all the way through.Record the right type of data
Count individuals where that makes sense. Estimate percentage cover where counting individuals doesn't.
Using the grid properly
In UK field methods, standard ecological quadrats are typically 50 cm × 50 cm (0.25 m²) and are often subdivided into 100 squares of 5 cm × 5 cm, with each square representing 1% of the total area when estimating cover (how to use a quadrat from NHBS).
That grid matters most when the vegetation is dense. You can't sensibly count every blade of grass, but you can estimate how many grid squares are occupied.
If a species appears across about half the small squares, its cover is about half the quadrat. The grid turns a vague guess into a reasoned estimate.
A quick visual walkthrough helps if you've only seen this on paper:
What teachers notice immediately
- Consistency beats speed. Slow, accurate recording is better than rushing through extra quadrats badly.
- Repeat samples matter. One quadrat tells you almost nothing about the full habitat.
- Neat notes save marks later. Fieldwork becomes useless if the table is unclear when you get back to class.
A strong field method sounds boring when described properly. That's exactly why it scores well. It's controlled, repeatable, and easy to justify.
Making Sense of the Numbers After Fieldwork
A page of field notes can look chaotic. That's fine. Biology fieldwork always looks a bit scrappy before the calculations start.
The trick is to convert those raw observations into a few measures that describe the habitat.
Frequency
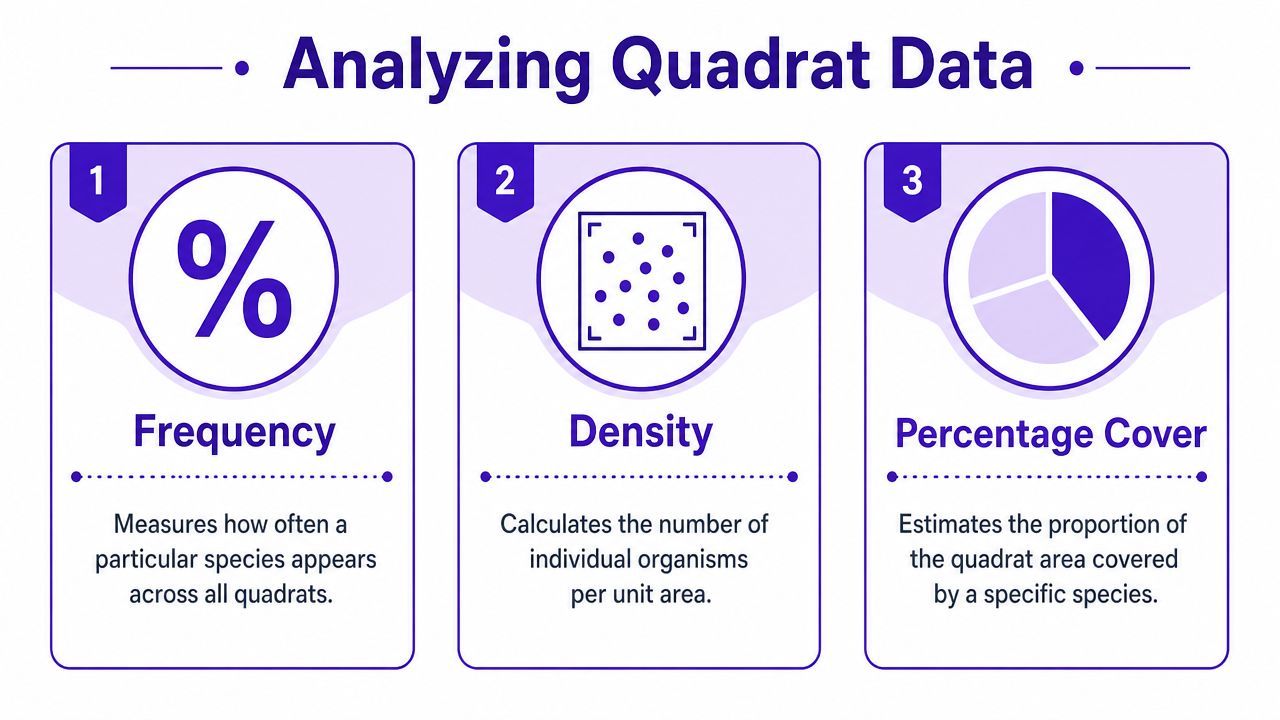
Frequency tells you how often a species appears across all your quadrats. It does not tell you how much of the quadrat it covers.
The formula is:
% frequency = (number of quadrats containing the species / total number of quadrats) × 100
A standard example used in ecology teaching is this: if a species is present in 7 out of 10 quadrats, its percentage frequency is 70% (quadrat survey explanation on YouTube).
That's simple, but students still mix it up with cover. Presence in a quadrat is enough for frequency. It doesn't matter whether the species covers a tiny patch or most of the frame.
Density
Density is about the number of individuals per unit area. This works best when you can count separate organisms clearly, such as daisies or dandelions.
A clean way to think about it is:
- count the individuals across your sampled quadrats
- work out the total area sampled
- divide individuals by area sampled
That gives you a rate per unit area. If the exam asks for an estimate of the total population in a wider area, you then scale up from that density.
Percentage cover
Percentage cover is the better measure when the organisms blend together, such as grasses, mosses, or clover. Instead of trying to count separate individuals, you estimate how much of the quadrat surface is occupied.
Three measures compared
- Frequency answers: how common is it across the site?
- Density answers: how many are there in a set area?
- Percentage cover answers: how much ground does it occupy?
Examiner mindset: if the plant can't be counted easily as separate individuals, percentage cover is usually the smarter metric.
A common confusion
Students often think the biggest number means the “most successful” species. Not always. A species could have high frequency because it appears in many quadrats, but low cover because it only shows up in tiny patches.
That's why these measures work best together. They describe different parts of the same ecological story.
Common Pitfalls and Pro Fieldwork Tips
Most dropped marks come from avoidable mistakes, not impossible biology.
A student can know exactly what are quadrats and still produce weak data if the method is sloppy. As a result, grade gaps open up. Strong students aren't always cleverer in the field. They're often just more consistent.
Mistakes that quietly ruin your results
Biased placement
Don't put the quadrat where the plants look interesting. That turns sampling into choosing.Changing the counting rule halfway through
Borderline plants must be handled with one fixed rule from start to finish.Guessing species names
If you don't know, note uncertainty properly. A wrong ID can damage the whole set.Messy recording
If your table is unclear, your later calculations become shaky.
Better habits that lift your work
One useful technique in UK botanical survey practice is to record very small amounts of cover carefully. Percentage covers below 1% can be recorded as 0.5% rather than being ignored or rounded to zero, which helps capture rare or very small species (botanical survey guidance from CEC Environment).
That's a tiny detail with big value. It stops uncommon species disappearing from the data just because they're easy to overlook.
Fieldwork habits that look professional
- Photograph each quadrat if your teacher allows it. It helps with checking IDs later.
- Work in pairs for estimates when possible. If two people estimate cover separately, you can compare and discuss.
- Protect the habitat. Don't trample patches unnecessarily, disturb wildlife, or leave gates wrong.
Good ecology isn't just accurate. It's careful, repeatable, and respectful of the site.
What to write in an evaluation
If you get an evaluation question, don't just say “human error”. Be specific.
Try points like:
- identification errors
- inconsistent edge rules
- too few samples
- non-random placement
- percentage cover estimated differently by different observers
Those comments sound sharper because they point to a real part of the method.
Ace Your Exam Questions on Quadrats
All of it becomes useful. In the exam, you're not rewarded for sounding scientific. You're rewarded for being precise.
A high-mark answer usually does three things:
- gives a valid practical method
- uses the right ecological term
- evaluates the reliability of the evidence
Sample question one
A student investigated the distribution of daisies in a field. They used a 0.5 m × 0.5 m quadrat. Describe how the student could use random sampling to collect valid data.
A strong answer would include points like these:
- Set up a grid by laying out two tape measures at right angles around the field.
- Generate random coordinates using a calculator or number generator.
- Place the quadrat at each coordinate in the same way each time.
- Repeat many times across the field to improve representativeness.
If this were being marked, those points map neatly onto method marks. Examiners like answers that follow the actual order of the task.
Sample question two
Some online guides love impossible arithmetic examples packed with invented figures. That's not helpful. Better to practise with methods you can trust and numbers you can follow.
Here's a clean one based on standard frequency work.
In a survey of 10 quadrats, a species was found in 7 quadrats. Calculate the percentage frequency.
The working is:
(7 ÷ 10) × 100 = 70%
That's your answer. Simple. If the exam also asks what it means, say the species was present in most sampled quadrats and was therefore widely distributed across the sampled area.
How to think like the mark scheme
A useful shortcut is to picture three examiner questions in the background:
| What the examiner wants | What your answer should show |
|---|---|
| Do you know the method? | Clear sequence, correct tool, fair sampling |
| Can you apply it? | Correct use of terms like frequency or cover |
| Can you judge quality? | A brief comment on bias, sample size, or reliability |
Where top students gain extra marks
Top answers often add one sensible evaluative point. Not five random ones. One good one.
For example:
- the sample must be representative of the habitat
- species identification must be accurate
- more repeats would improve reliability
- a gridded quadrat would improve cover estimates
That final evaluative sentence can make the difference between a basic answer and a strong one.
If you want to drill this under timed conditions, Exam Practice for A-Level style practice is useful because quadrat questions are all about turning practical knowledge into tight written answers.
The bigger lesson is this. Quadrat questions aren't there to trick you. They test whether you can sample a habitat fairly, record observations carefully, and explain your reasoning clearly. Once you can do that, ecology fieldwork stops feeling vague and starts feeling very beatable.
If you want revision that mirrors how UK exam boards award marks, MasteryMind is built for that. It gives GCSE and A-Level students examiner-aligned questions, clear feedback, and targeted practice across biology and other subjects, so you can tighten weak spots fast and walk into the exam knowing exactly how to turn knowledge into marks.
Ready to master this topic?
Practise with quizzes, blurt exercises and exam questions on MasteryMind.
7 days Premium · Then free forever · No card, no charge