AQA · A-Level · Biology
Course version: 7402 · Version from Sept 2016
Quantitative investigations of variation within a species involve:…
Full specification wording
Investigating diversity: Quantitative investigations of variation within a species involve: collecting data from random samples calculating a mean value of the collected data and the standard deviation of that mean interpreting mean values and their standard deviations.
Quantitative investigations of variation require three steps.
Checked against the AQA 7402 specification (opens in a new tab) on .
- Point 3 of 3
Study notes
From the checked teaching notes for this specification point.
The idea
Quantitative investigations of variation require three steps. First, collect data from random samples to eliminate investigator bias, ensuring every individual has an equal chance of selection. For example, use a random number generator to find grid coordinates for quadrats. A large sample size reduces the effect of chance. Second, calculate the mean to summarise the data, and the standard deviation (SD) to measure the spread of values around the mean. Finally, interpret these values. A small SD shows data clustered tightly around the mean. If SD error bars overlap, the difference between means is likely not significant. If they do not overlap, it suggests a significant difference, though a statistical test is still needed to confirm this.
What earns the marks
- Describe random sampling as ensuring every individual has an equal chance of selection, which avoids investigator bias.
- State that a large sample size or using repeat samples reduces the effect of chance and makes the sample more representative of the population.
- Explain that overlapping standard deviation bars indicate the difference between means is likely not significant and could be due to chance.
- State that non-overlapping standard deviation bars suggest a significant difference, but explicitly note that a statistical test is required to confirm significance.
- Identify that standard deviation measures the spread of data around the mean, rather than being a statistical test itself.
Common mistakes and how to put them right
Stating that non-overlapping standard deviations prove a difference is statistically significant.
Put it right: State that non-overlap only suggests significance; a statistical test is required to confirm it.
Describing random sampling as picking individuals 'at random' by eye.
Put it right: Recognise that picking by eye introduces investigator bias; true random sampling requires an objective method like a random number generator.
Confusing standard deviation with a statistical test.
Put it right: Standard deviation is a measure of data spread around the mean, whereas a statistical test determines the probability that a difference is due to chance.
Interpreting a large standard deviation as an error in the experimental method.
Put it right: Understand that a large standard deviation reflects a wide natural variation or spread of values within the sampled population.
Exam tips
- When evaluating data with error bars, always state whether the standard deviations overlap before commenting on the likelihood of the difference being significant.
- If asked to evaluate a conclusion based only on means and standard deviations, point out that a statistical test has not been carried out to confirm significance.
Try the lesson
The start of the Investigating diversity: Quantitative investigations of variation within a species involve: collecting data from random samples calculating a mean value of the collected data and the standard deviation of that mean interpreting mean values and their standard deviations. lesson, made from checked teaching notes for this specification point.
Have a go first
Why must data be collected from random samples when investigating variation within a species?
Listen
Quantitative investigations of variation require three steps. First, collect data from random samples to eliminate investigator bias, ensuring every individual has an equal chance of selection. For example, use a random number generator to find grid coordinates for quadrats. A large sample size reduces the effect of chance. Second, calculate the mean to summarise the data, and the standard deviation (SD) to measure the spread of values around the mean. Finally, interpret these values. A small SD shows data clustered tightly around the mean. If SD error bars overlap, the difference between means is likely not significant. If they do not overlap, it suggests a significant difference, though a statistical test is still needed to confirm this. A strong answer earns marks for these points. Describe random sampling as ensuring every individual has an equal chance of selection, which avoids investigator bias. State that a large sample size or using repeat samples reduces the effect of chance and makes the sample more representative of the population. Explain that overlapping standard deviation bars indicate the difference between means is likely not significant and could be due to chance. State that non-overlapping standard deviation bars suggest a significant difference, but explicitly note that a statistical test is required to confirm significance. A common slip: Stating that non-overlapping standard deviations prove a difference is statistically significant. Instead, State that non-overlap only suggests significance; a statistical test is required to confirm it. Exam tip: When evaluating data with error bars, always state whether the standard deviations overlap before commenting on the likelihood of the difference being significant.
See it
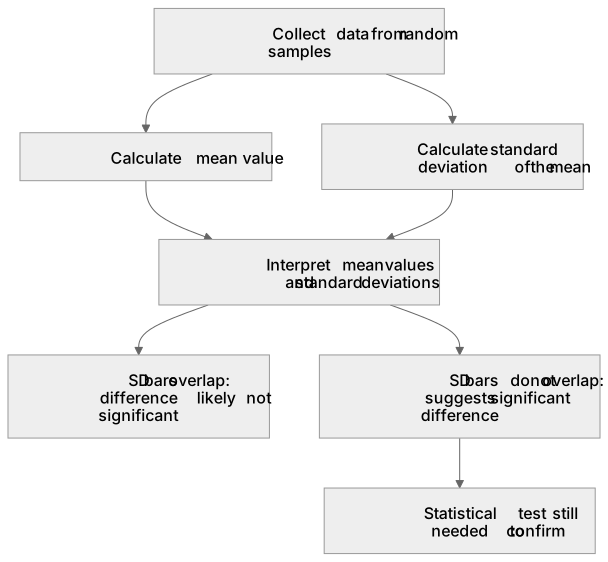
Label the diagram
Some boxes have lost their names. Pick the right name for each number.
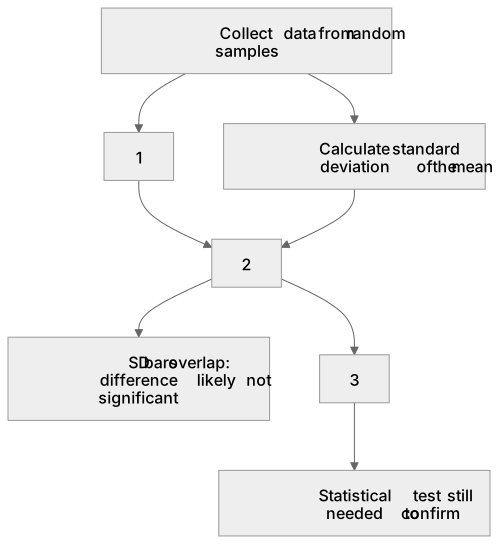
1Box 1
2Box 2
3Box 3
There is more to this lesson
The full lesson goes on to check your understanding and help you earn the marks. Create a free account to carry on, with your progress saved.
A week of Premium from your first lesson · Then the free plan continues · No card, no charge
Test your understanding of Investigating diversity: Quantitative investigations of variation within a species involve: collecting data from random samples calculating a mean value of the collected data and the standard deviation of that mean interpreting mean values and their standard deviations.
Active recall beats re-reading. Take an instant quiz now to test what you’ve learned and lock it into long-term memory.
A week of Premium from your first lesson · Then the free plan continues · No card, no charge