AQA · A-Level · Biology
Course version: 7402 · Version from Sept 2016
The loading, transport and unloading of oxygen in relation to the…
Full specification wording
Mass transport in animals: The loading, transport and unloading of oxygen in relation to the oxyhaemoglobin dissociation curve.
The oxyhaemoglobin dissociation curve plots percentage saturation of haemoglobin against partial pressure of oxygen (pO₂).
Checked against the AQA 7402 specification (opens in a new tab) on .
- Point 3 of 14
- 4 key terms
Study notes
From the checked teaching notes for this specification point.
The idea
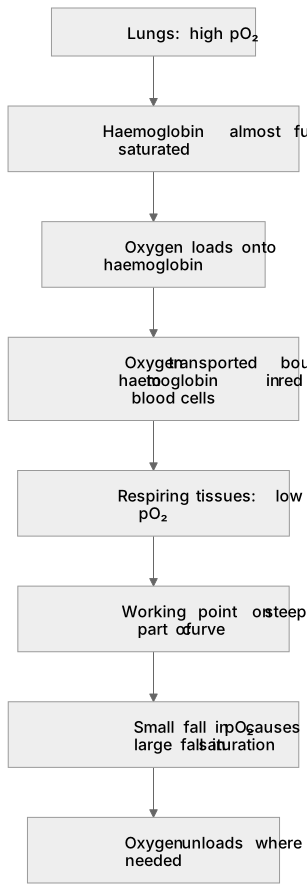
The oxyhaemoglobin dissociation curve plots percentage saturation of haemoglobin against partial pressure of oxygen (pO₂). Oxygen is transported bound to haemoglobin in red blood cells from the lungs to respiring tissues. The curve is sigmoid (S-shaped). At high pO₂ in the lungs, haemoglobin is almost fully saturated and loads oxygen. In respiring tissues, pO₂ is low, placing the working point on the steep part of the curve. Here, a small fall in pO₂ causes a large fall in saturation, unloading oxygen where needed. Curve position indicates affinity: a shift to the left means higher affinity (loads more readily), while a shift to the right means lower affinity (unloads more easily).
What earns the marks
- Reading the correct percentage saturation from the graph at a stated partial pressure of oxygen.
- Stating that haemoglobin has a high affinity for oxygen at the high partial pressure found in the lungs, so it loads oxygen there.
- Stating that oxygen is transported bound to haemoglobin in the blood from the lungs to respiring tissues.
- Explaining that the low partial pressure of oxygen in respiring tissues causes dissociation and unloading.
- Sketching a shifted curve that maintains the sigmoid shape, starts at the origin, and finishes at the same maximum percentage saturation if only affinity has changed.
- Quoting figures from the graph with the correct unit when comparing loading and unloading.
Common mistakes and how to put them right
Reading the y-axis as oxygen concentration rather than percentage saturation of haemoglobin.
Treating the x-axis as oxygen concentration instead of partial pressure (pO₂), often omitting the kPa unit.
Drawing a shifted curve that finishes below the original maximum saturation when only affinity has changed.
Put it right: The maximum should remain the same.
Stating that haemoglobin loads more oxygen at low partial pressures.
Put it right: It actually has a lower affinity and unloads oxygen.
Exam tips
- Quote two figures with units from the graph; a described trend rarely earns full marks on a data question.
- Use 'affinity for oxygen' when discussing the position of the curve and 'percentage saturation' for values on the y-axis.
- When asked to sketch a shifted curve for a change in affinity, keep the origin the same, move the middle section, and maintain the original maximum saturation.
Try the lesson
The start of the Mass transport in animals: The loading, transport and unloading of oxygen in relation to the oxyhaemoglobin dissociation curve. lesson, made from checked teaching notes for this specification point.
Have a go first
At which part of the circulatory system does haemoglobin load oxygen most readily?
Listen
The oxyhaemoglobin dissociation curve plots percentage saturation of haemoglobin against partial pressure of oxygen (pO₂). Oxygen is transported bound to haemoglobin in red blood cells from the lungs to respiring tissues. The curve is sigmoid (S-shaped). At high pO₂ in the lungs, haemoglobin is almost fully saturated and loads oxygen. In respiring tissues, pO₂ is low, placing the working point on the steep part of the curve. Here, a small fall in pO₂ causes a large fall in saturation, unloading oxygen where needed. Curve position indicates affinity: a shift to the left means higher affinity (loads more readily), while a shift to the right means lower affinity (unloads more easily). A strong answer earns marks for these points. Reading the correct percentage saturation from the graph at a stated partial pressure of oxygen. Stating that haemoglobin has a high affinity for oxygen at the high partial pressure found in the lungs, so it loads oxygen there. Stating that oxygen is transported bound to haemoglobin in the blood from the lungs to respiring tissues. Explaining that the low partial pressure of oxygen in respiring tissues causes dissociation and unloading. Exam tip: Quote two figures with units from the graph; a described trend rarely earns full marks on a data question.
See it
Put it in order
Put these steps in the order they happen.
- 1. Respiring tissues: low pO₂
- 2. Oxygen unloads where needed
- 3. Working point on steep part of curve
- 4. Lungs: high pO₂
- 5. Haemoglobin almost fully saturated
- 6. Small fall in pO₂ causes large fall in saturation
- 7. Oxygen loads onto haemoglobin
- 8. Oxygen transported bound to haemoglobin in red blood cells
Key words
Say what each word means before you turn the card.
sigmoid curve
Try answering aloud or in your head before turning the card.
percentage saturation
Try answering aloud or in your head before turning the card.
partial pressure of oxygen
Try answering aloud or in your head before turning the card.
affinity
Try answering aloud or in your head before turning the card.
See every definition
- sigmoid curve
- The oxyhaemoglobin dissociation curve is S-shaped, plotting percentage saturation of haemoglobin against partial pressure of oxygen.
- percentage saturation
- The value on the y-axis of the oxyhaemoglobin dissociation curve, plotted against partial pressure of oxygen.
- partial pressure of oxygen
- The value on the x-axis of the oxyhaemoglobin dissociation curve, high in the lungs and low in respiring tissues.
- affinity
- Indicated by the position of the curve: a shift to the left means higher affinity, while a shift to the right means lower affinity.
Label the diagram
Some boxes have lost their names. Pick the right name for each number.
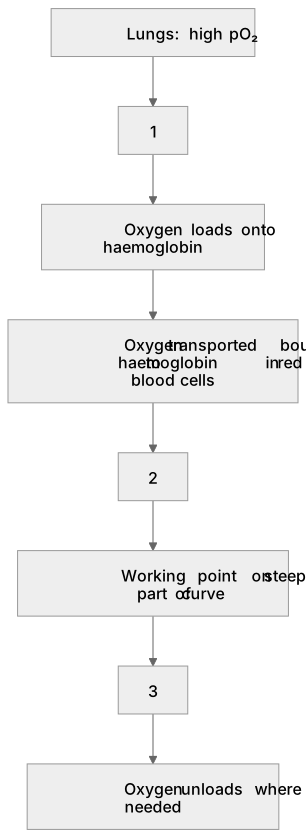
1Box 1
2Box 2
3Box 3
There is more to this lesson
The full lesson goes on to check your understanding and help you earn the marks. Create a free account to carry on, with your progress saved.
A week of Premium from your first lesson · Then the free plan continues · No card, no charge
Test your understanding of Mass transport in animals: The loading, transport and unloading of oxygen in relation to the oxyhaemoglobin dissociation curve.
Active recall beats re-reading. Take an instant quiz now to test what you’ve learned and lock it into long-term memory.
A week of Premium from your first lesson · Then the free plan continues · No card, no charge