AQA · A-Level · Biology
Course version: 7402 · Version from Sept 2016
Students should be able to: interpret data provided from investigations…
Full specification wording
Regulation of transcription and translation (A-level only): Students should be able to: interpret data provided from investigations into gene expression evaluate appropriate data for the relative influences of genetic and environmental factors on phenotype.
Data interpretation here involves mRNA concentrations, promoter methylation, or monozygotic twin comparisons.
Checked against the AQA 7402 specification (opens in a new tab) on .
- Point 7 of 7
- 4 key terms
Study notes
From the checked teaching notes for this specification point.
The idea
Data interpretation here involves mRNA concentrations, promoter methylation, or monozygotic twin comparisons. Interpretation requires two steps. First, describe the pattern using figures with units and make requested comparisons. Second, explain the pattern using mechanisms like transcription factor binding, DNA methylation, histone acetylation, or RNA interference. Evaluating genetic versus environmental influences requires careful experimental design. While monozygotic twins share their alleles, phenotypic differences between them are largely attributed to environmental factors, though somatic mutations and epigenetic effects also contribute. Conversely, genetically different individuals raised in identical conditions highlight genetic influences.
What earns the marks
- Describe the pattern using figures quoted from the graph or table, including units.
- Use error bars, standard deviations or statistical tests to state whether a difference is significant.
- Identify controlled variables that allow conclusions, such as identical genotypes highlighting environmental or epigenetic differences.
- Explain the result using a named mechanism of gene expression, such as transcription factors, methylation, acetylation or RNAi.
- State a valid limitation, such as correlation not showing causation, small sample sizes, or short study durations.
Common mistakes and how to put them right
Writing 'the results are significant' without specifying what is greater, lower or different.
Describing the graph in detail but failing to explain it biologically using gene expression mechanisms.
Assuming phenotypic differences in monozygotic twins are exclusively environmental, ignoring somatic mutations or epigenetic factors.
Treating a correlation between an environmental factor and expression as proof of causation.
Exam tips
- Split your answer: first describe the data with figures, then provide the biological explanation.
- When error bars or standard deviations are shown, state whether they overlap and what this means for significance before concluding.
Try the lesson
The start of the Regulation of transcription and translation (A-level only): Students should be able to: interpret data provided from investigations into gene expression evaluate appropriate data for the relative influences of genetic and environmental factors on phenotype. lesson, made from checked teaching notes for this specification point.
Have a go first
A scientist measures the mRNA transcribed from a particular gene in liver cells and in muscle cells from the same organism. The mRNA is present at a high concentration in liver cells but at a very low concentration in muscle cells. What does this difference most directly indicate about the gene?
Listen
Data interpretation here involves mRNA concentrations, promoter methylation, or monozygotic twin comparisons. Interpretation requires two steps. First, describe the pattern using figures with units and make requested comparisons. Second, explain the pattern using mechanisms like transcription factor binding, DNA methylation, histone acetylation, or RNA interference. Evaluating genetic versus environmental influences requires careful experimental design. While monozygotic twins share their alleles, phenotypic differences between them are largely attributed to environmental factors, though somatic mutations and epigenetic effects also contribute. Conversely, genetically different individuals raised in identical conditions highlight genetic influences. A strong answer earns marks for these points. Describe the pattern using figures quoted from the graph or table, including units. Use error bars, standard deviations or statistical tests to state whether a difference is significant. Identify controlled variables that allow conclusions, such as identical genotypes highlighting environmental or epigenetic differences. Explain the result using a named mechanism of gene expression, such as transcription factors, methylation, acetylation or RNAi. Exam tip: Split your answer: first describe the data with figures, then provide the biological explanation.
See it
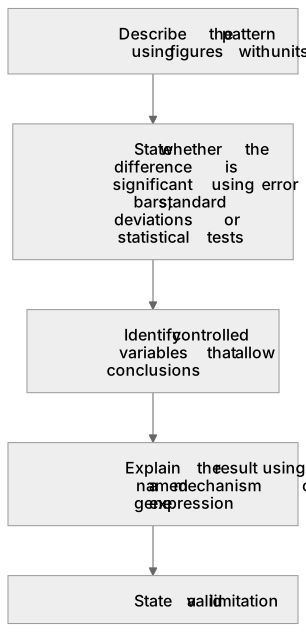
Put it in order
Put these steps in the order they happen.
- 1. State whether the difference is significant using error bars, standard deviations or statistical tests
- 2. Identify controlled variables that allow conclusions
- 3. Describe the pattern using figures with units
- 4. State a valid limitation
- 5. Explain the result using a named mechanism of gene expression
Key words
Say what each word means before you turn the card.
interpreting expression data
Try answering aloud or in your head before turning the card.
significance and error bars
Try answering aloud or in your head before turning the card.
genotype versus environment
Try answering aloud or in your head before turning the card.
correlation not causation
Try answering aloud or in your head before turning the card.
See every definition
- interpreting expression data
- Describing the pattern using figures quoted from the graph or table, including units, then explaining it using a named mechanism of gene expression.
- significance and error bars
- Using error bars, standard deviations or statistical tests to state whether a difference is significant, saying what is greater, lower or different.
- genotype versus environment
- Monozygotic twins share their alleles, so phenotypic differences between them are largely attributed to environmental factors, though somatic mutations and epigenetic effects also contribute.
- correlation not causation
- A valid limitation is that a correlation between an environmental factor and expression does not show causation.
Label the diagram
Some boxes have lost their names. Pick the right name for each number.
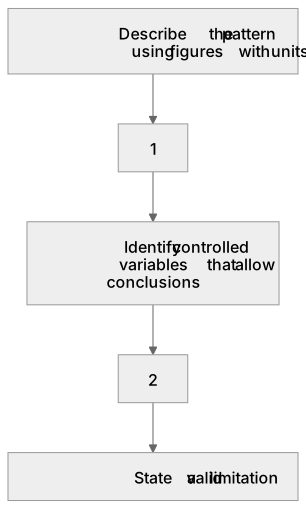
1Box 1
2Box 2
There is more to this lesson
The full lesson goes on to check your understanding and help you earn the marks. Create a free account to carry on, with your progress saved.
A week of Premium from your first lesson · Then the free plan continues · No card, no charge
Test your understanding of Regulation of transcription and translation (A-level only): Students should be able to: interpret data provided from investigations into gene expression evaluate appropriate data for the relative influences of genetic and environmental factors on phenotype.
Active recall beats re-reading. Take an instant quiz now to test what you’ve learned and lock it into long-term memory.
A week of Premium from your first lesson · Then the free plan continues · No card, no charge