Populations — OCR A-Level Study Guide
Exam Board: OCR | Level: A-Level
Master OCR A-Level Biology's Populations topic (7.2) with this comprehensive guide. We'll break down carrying capacity, predator-prey cycles, and the Lincoln Index to help you secure top marks in your exam.
## Overview
Welcome to the study of Populations, a cornerstone of ecology and a significant component of OCR A-Level Biology's Module 6. This topic explores the dynamic and ever-changing nature of life, investigating the factors that govern how populations grow, shrink, and interact within their ecosystems. Understanding these principles is not just about memorising definitions; it's about applying ecological theory to real-world scenarios, from managing conservation projects to predicting the impact of environmental change. Examiners frequently test this area using data analysis and application-based questions, so a firm grasp of the core concepts is essential for achieving a high grade. This guide will equip you with the knowledge of population dynamics, competition, and sampling techniques, directly linking them to the assessment objectives to ensure every minute of your revision is exam-focused.

## Key Concepts
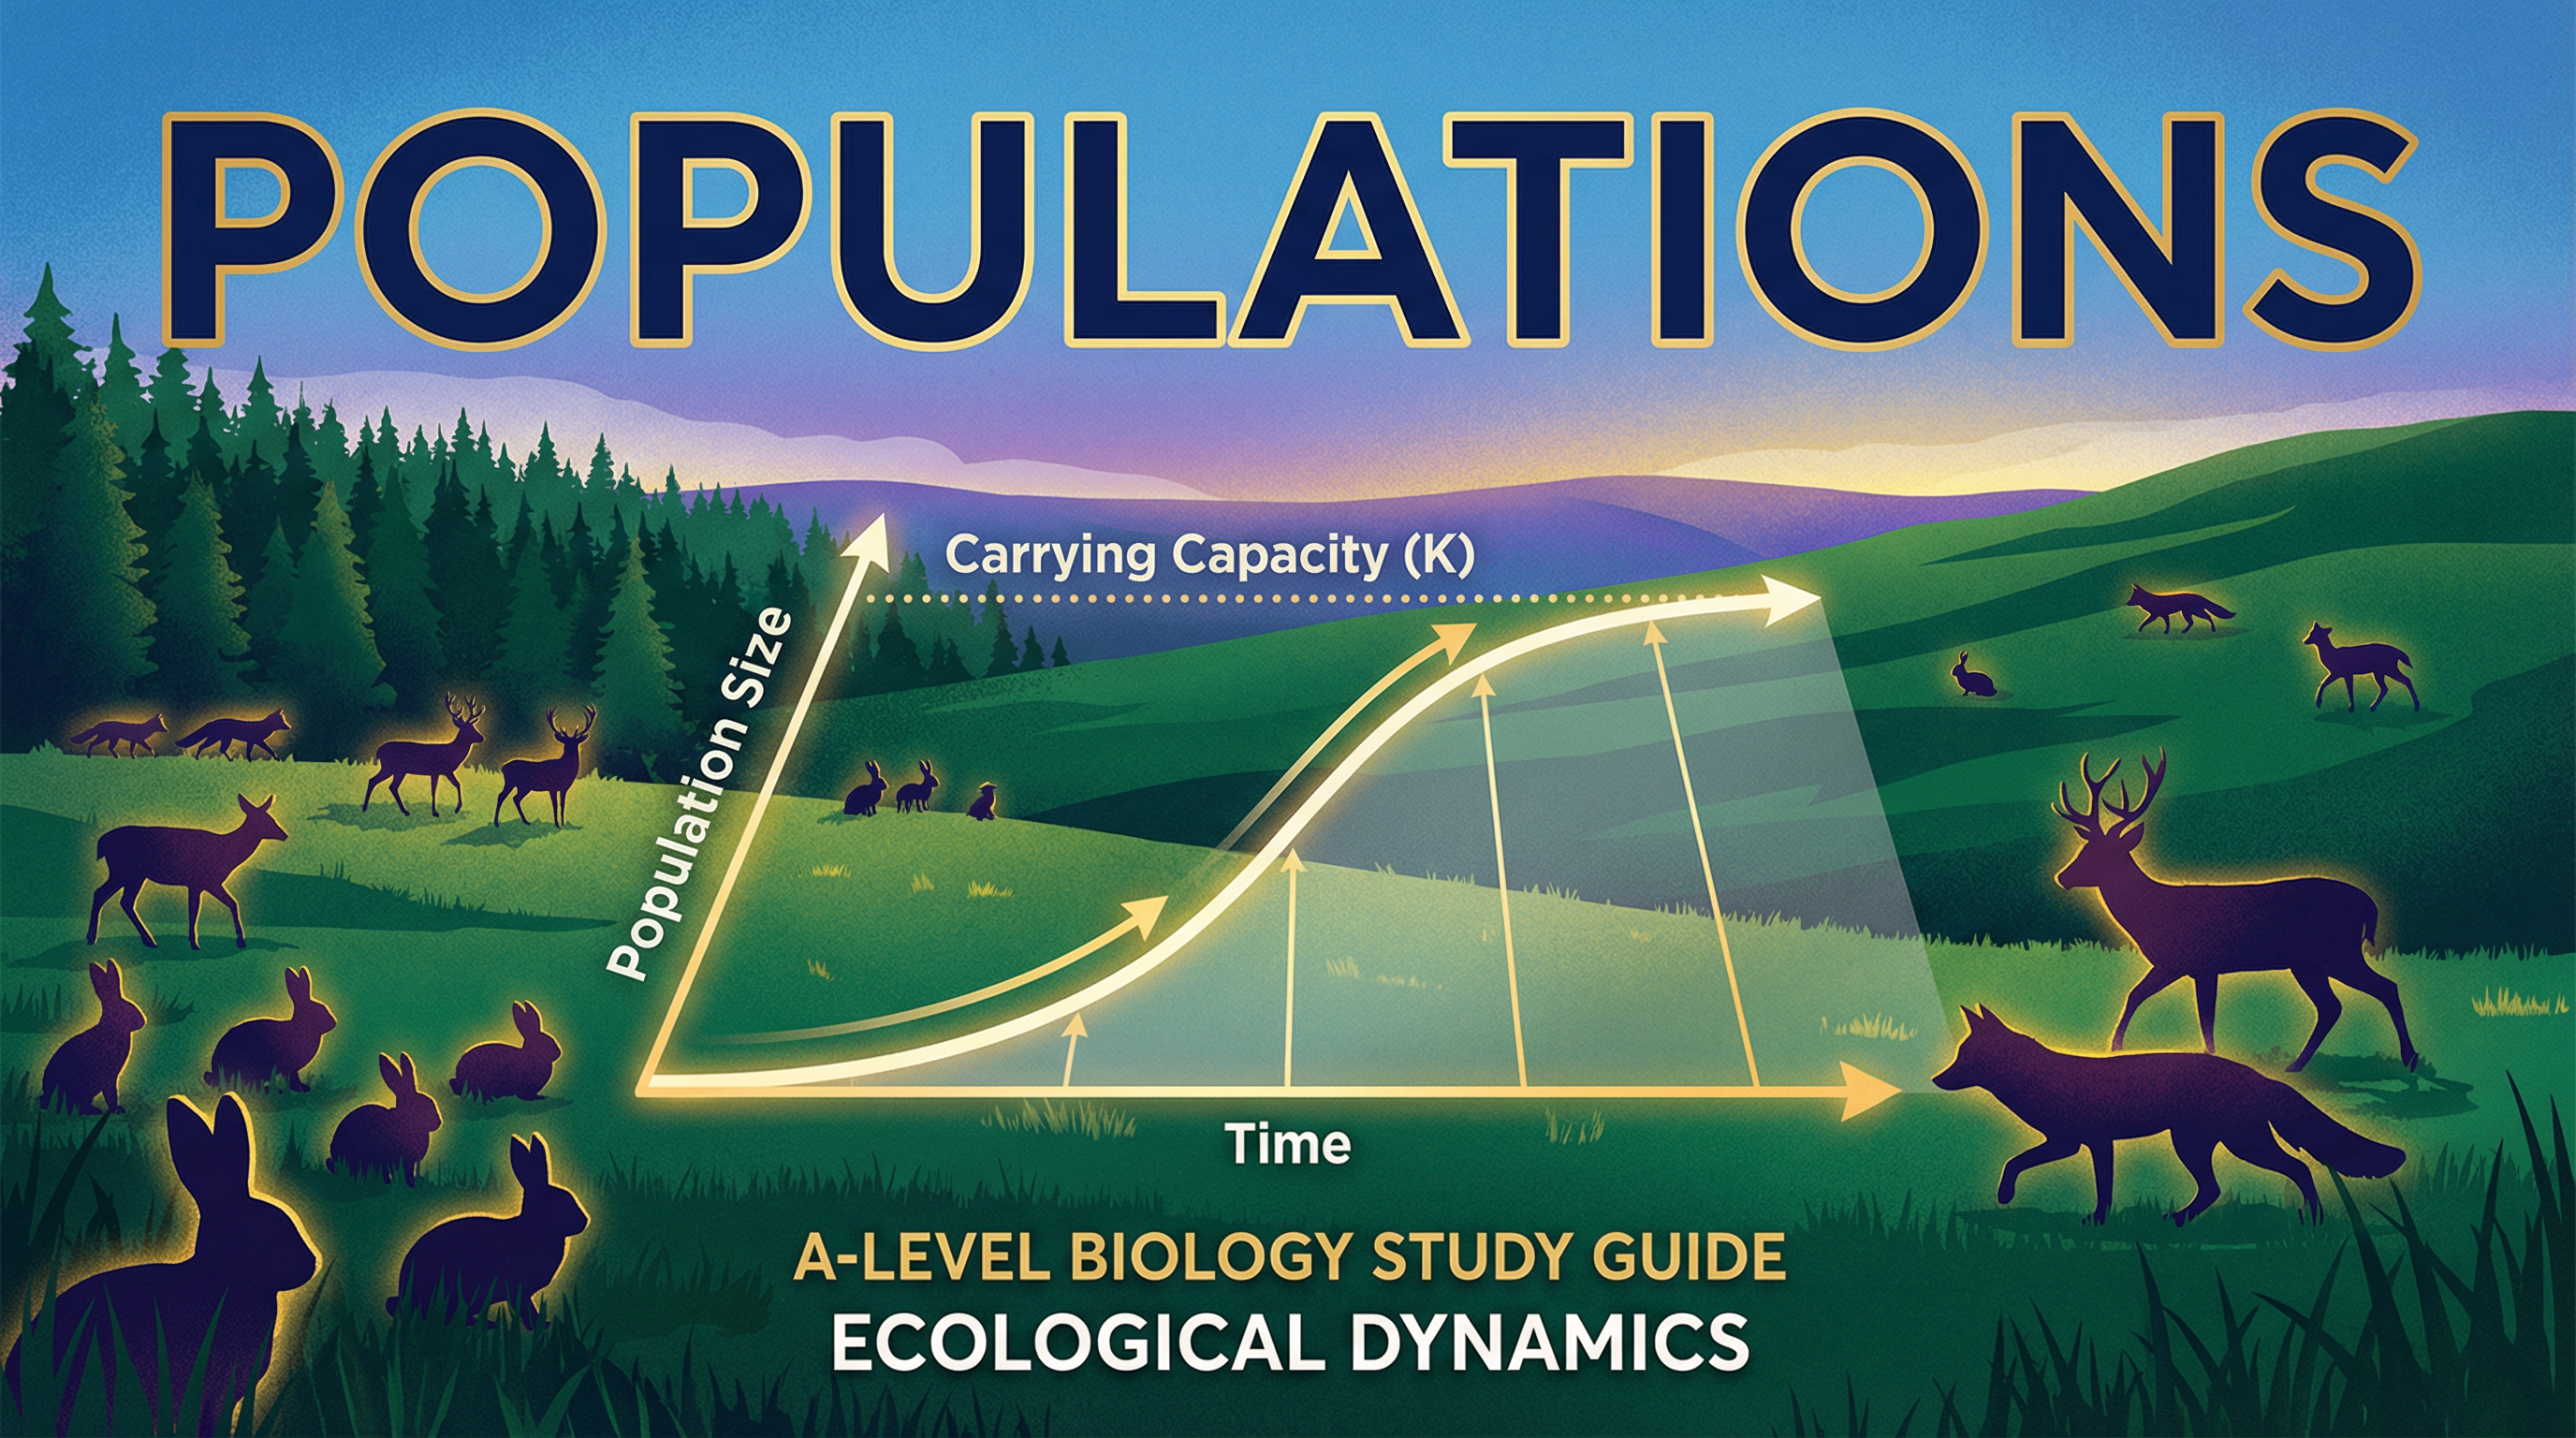
### Concept 1: Carrying Capacity (K)
The carrying capacity is the maximum population size that an environment can sustainably support over a long period. It isn't a fixed number; it's a dynamic ceiling determined by the availability of resources like food, water, and shelter. When a population is small and resources are abundant, it experiences rapid, exponential growth. However, as the population approaches the carrying capacity, its growth rate slows and eventually stabilises. This is because of **limiting factors**, which can be categorised into two types:
* **Density-dependent factors**: Their impact intensifies as the population density increases. Examples include disease (spreads faster in crowded conditions), predation (predators are more successful when prey is abundant), and competition for resources.
* **Density-independent factors**: These affect the population regardless of its density. Examples include natural disasters like floods, fires, or extreme weather events.
This interplay of factors results in the characteristic **S-shaped (sigmoid) logistic growth curve**.
### Concept 2: Predator-Prey Relationships
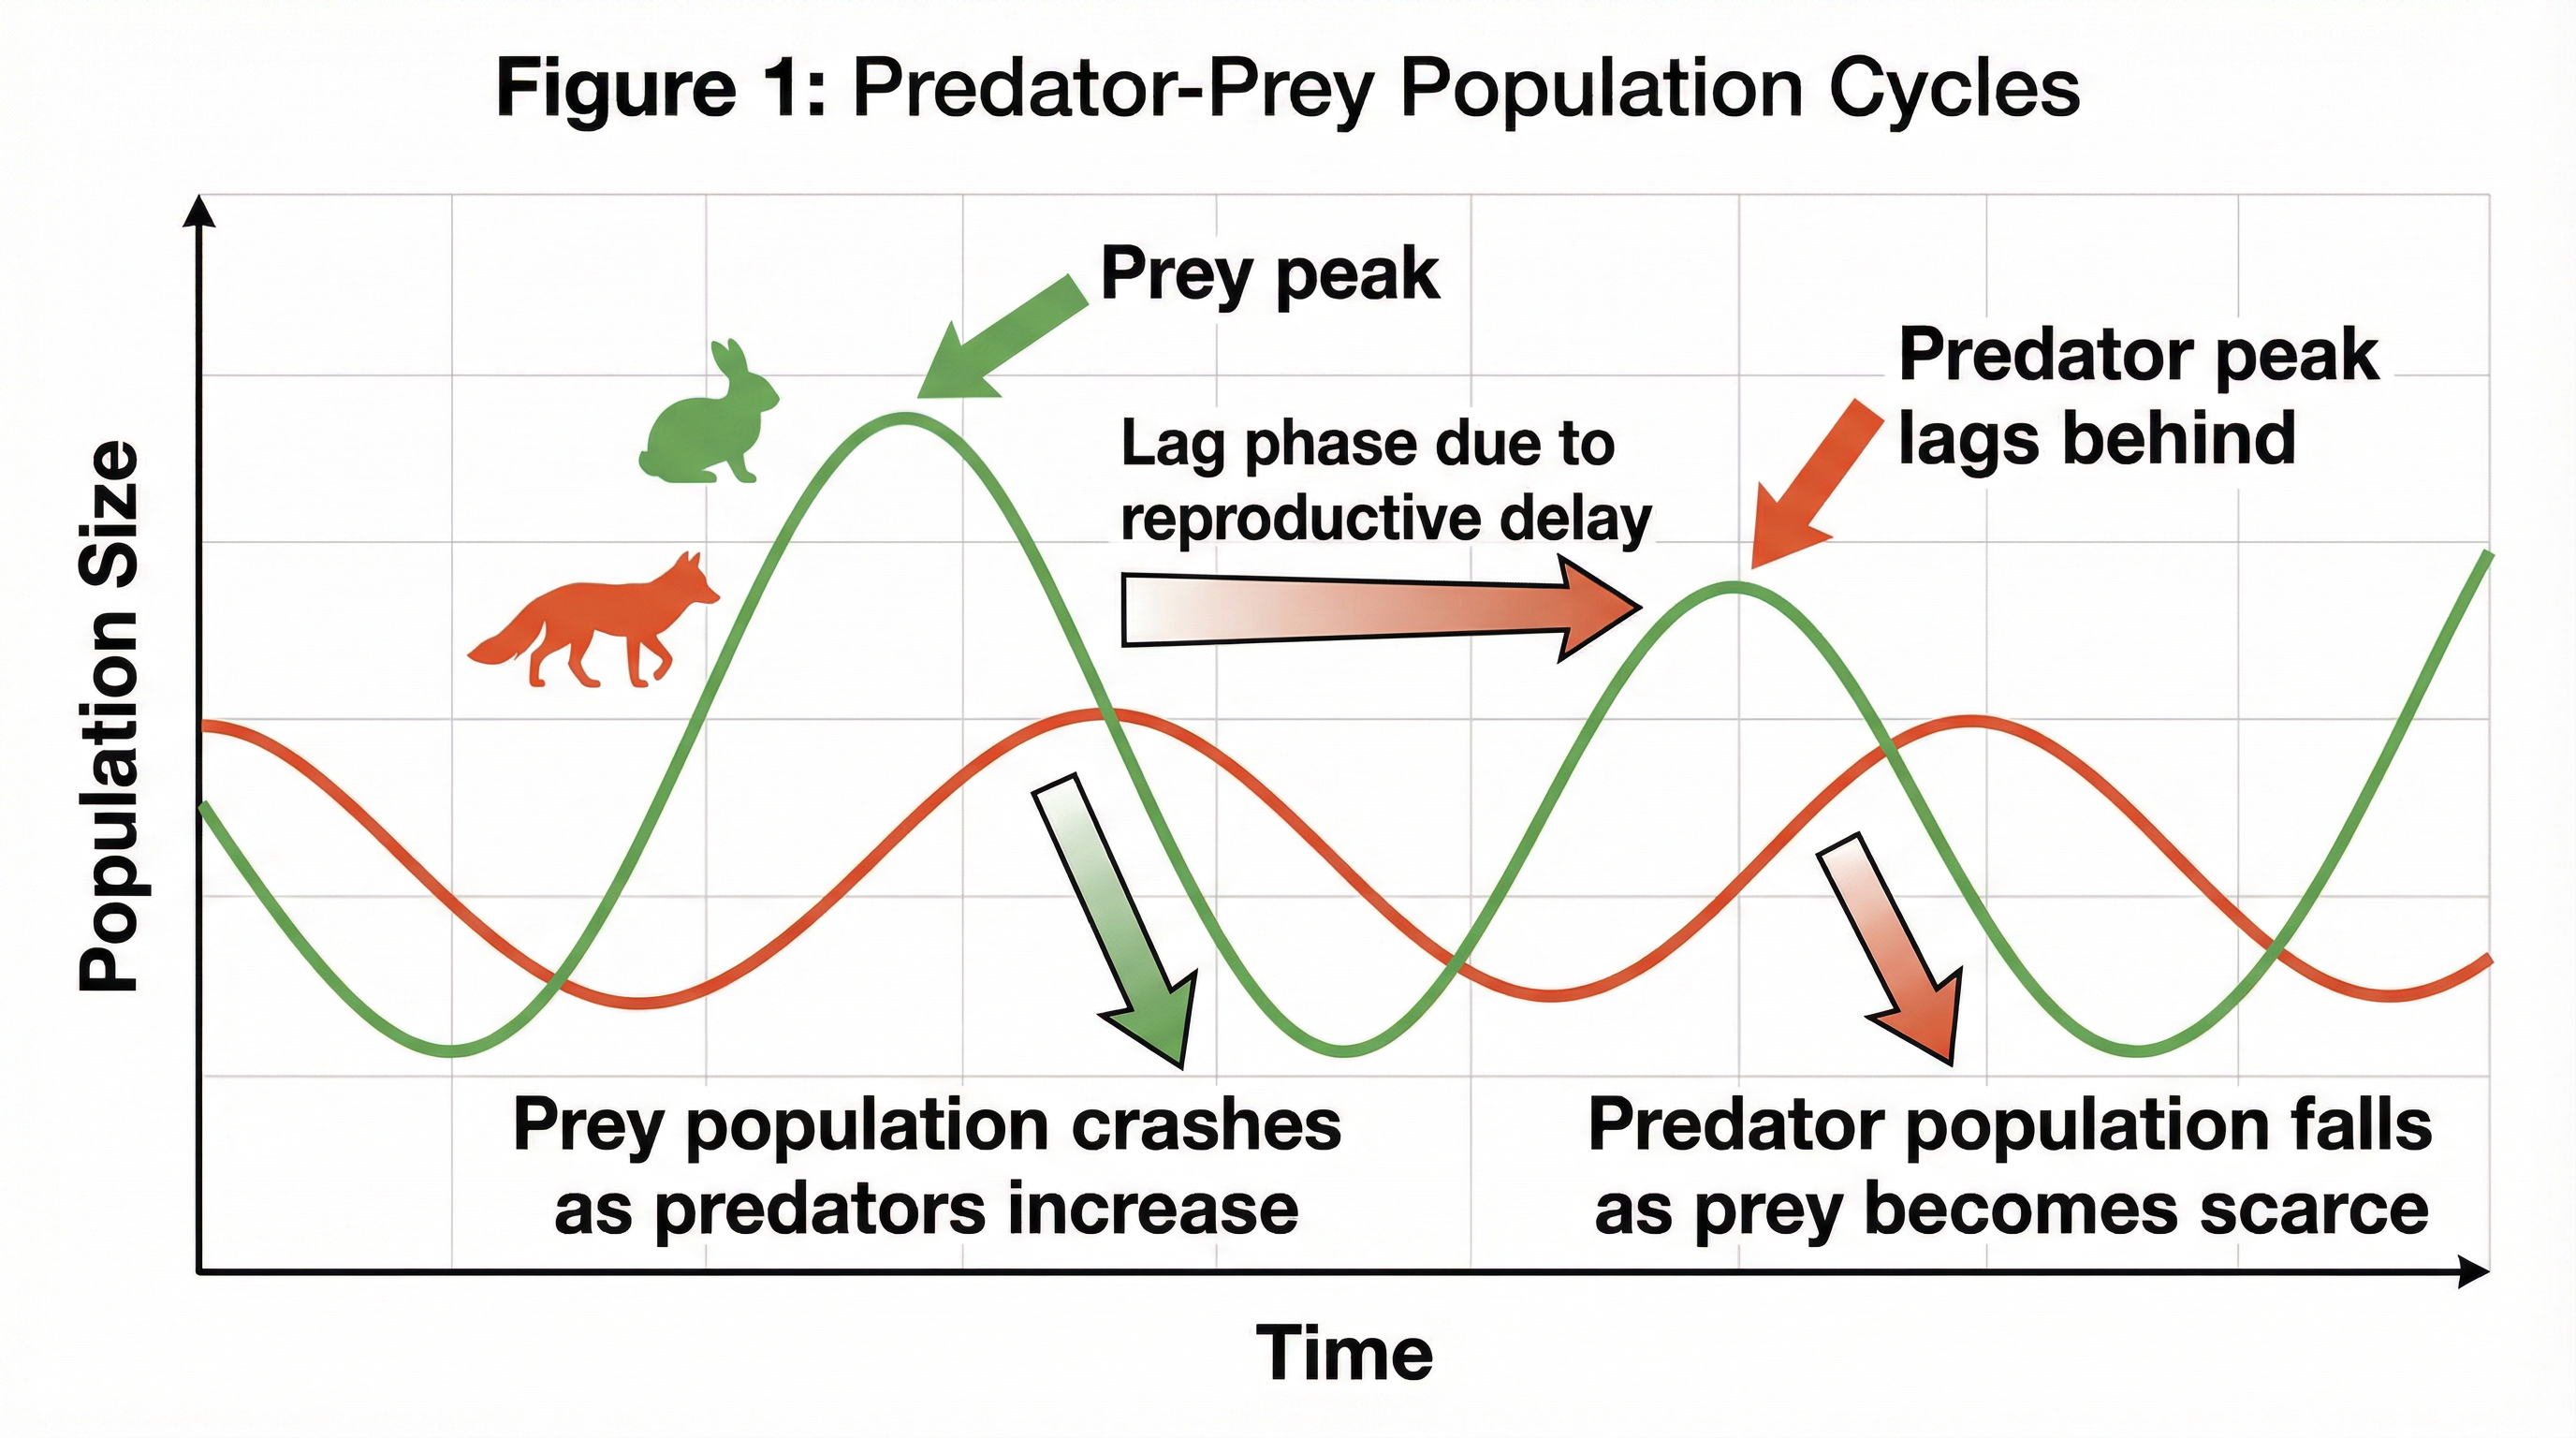
This classic ecological interaction results in cyclical fluctuations in the populations of both predator and prey. It is a key example of a negative feedback mechanism. The cycle follows a predictable pattern:
1. **Prey numbers increase**: With abundant resources and few predators, the prey population grows.
2. **Predator numbers increase**: The larger food supply allows the predator population to grow. Crucially, this happens after a **lag phase** because it takes time for predators to reproduce and for their offspring to mature.
3. **Prey numbers decrease**: The increased number of predators consumes more prey, causing the prey population to decline.
4. **Predator numbers decrease**: With fewer prey to eat, the predator population declines due to starvation and lower reproductive success.
This leads to the famous oscillating graph where the predator's population peak always follows the prey's peak. Candidates often lose marks by stating the peaks occur simultaneously.
### Concept 3: Competition
Competition arises when two or more individuals require the same limited resource. OCR examiners expect candidates to distinguish between two forms:
* **Intraspecific Competition**: Occurs between individuals of the *same* species. This is a major density-dependent factor that limits population size and drives the logistic growth curve.
* **Interspecific Competition**: Occurs between individuals of *different* species. If two species occupy the exact same niche, one will inevitably outcompete the other, leading to its local extinction. This is the **competitive exclusion principle**. However, species can coexist if they exhibit **niche differentiation**, for example, by feeding at different times or in different locations.
## Mathematical/Scientific Relationships
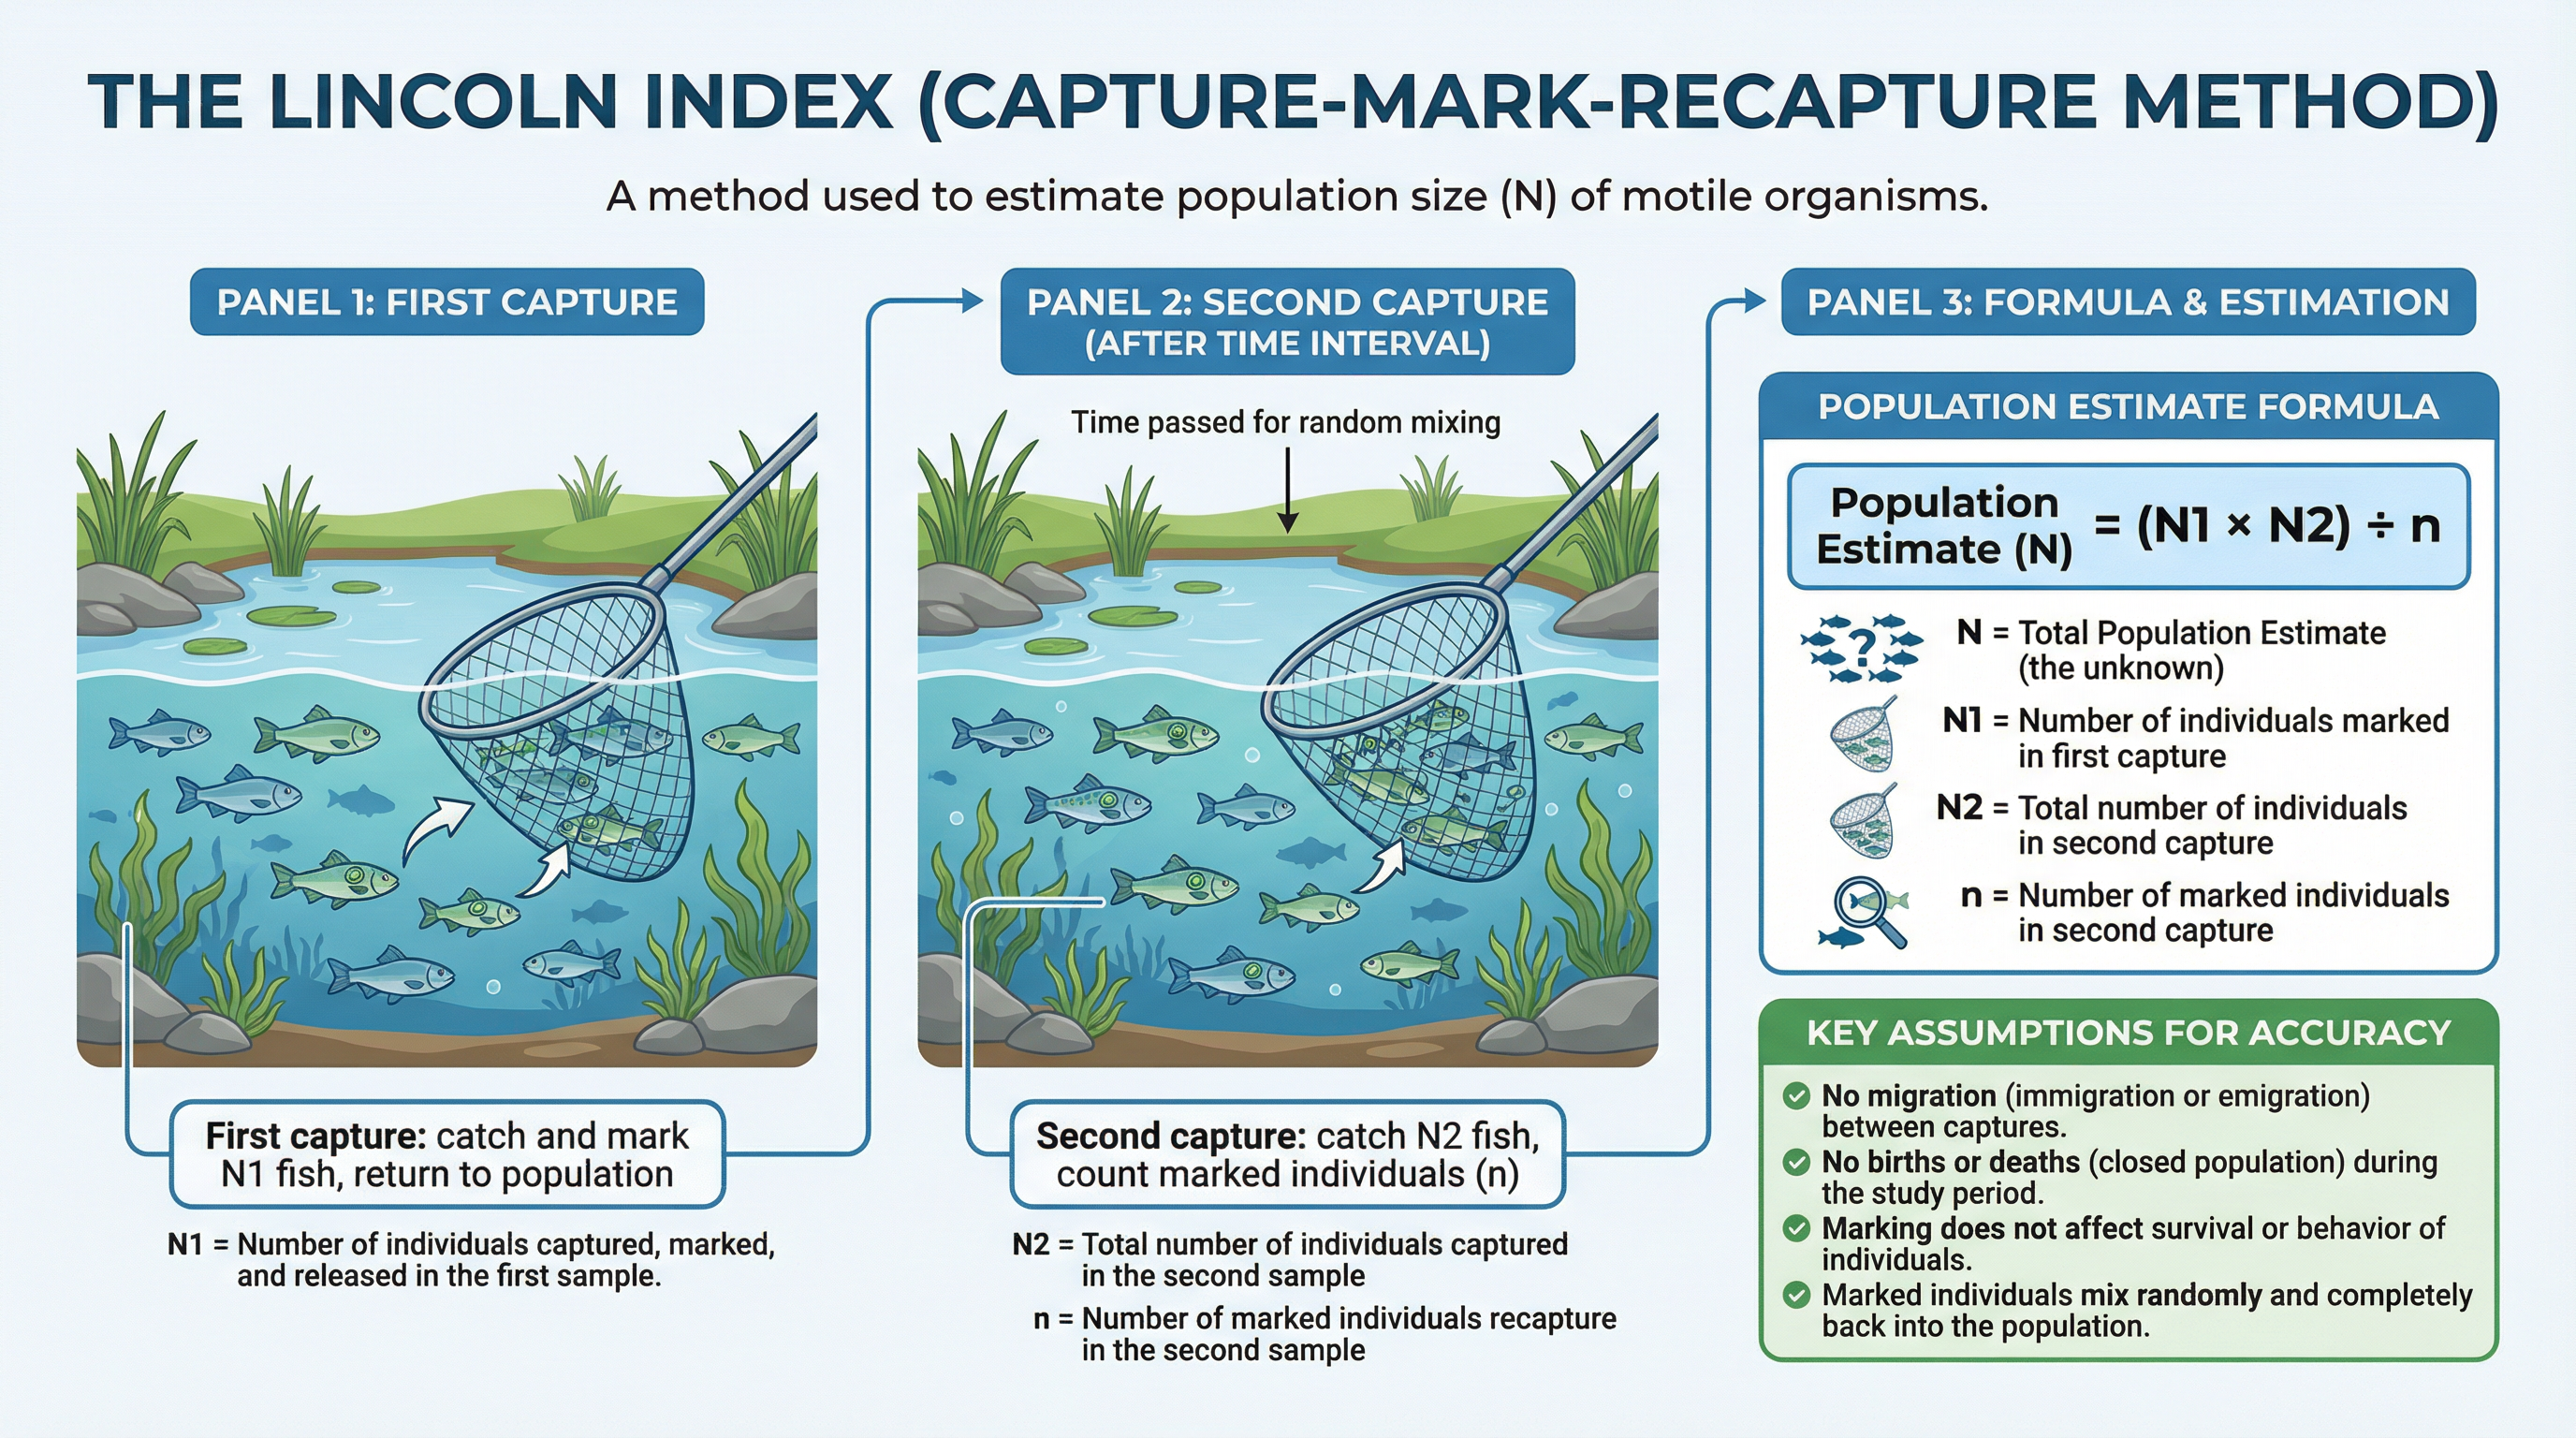
### The Lincoln Index (Capture-Mark-Recapture)
This formula is used to estimate the size of a motile (moving) population.
**Formula**: `Population Estimate (N) = (Number in first sample (N1) × Number in second sample (N2)) / Number of marked individuals in second sample (n)`
* **N**: The total population estimate (what you are calculating).
* **N1**: The number of individuals initially caught, marked, and released.
* **N2**: The total number of individuals caught in the second sample.
* **n**: The number of *marked* individuals recaptured in the second sample.
**Status**: Must memorise. This formula is NOT given on the formula sheet.
## Practical Applications
This topic has direct practical applications in conservation and resource management. For example, the Lincoln Index is used by ecologists to monitor populations of fish, insects, and other animals to assess the health of an ecosystem. Understanding carrying capacity is vital for sustainable agriculture and fisheries, ensuring that stocks are not over-exploited. Conservation strategies, such as the reintroduction of species or the management of nature reserves, are entirely based on the principles of population dynamics. For instance, controlling the population of an invasive species (interspecific competition) is a common conservation strategy to protect native wildlife.