AQA · GCSE · Business
Course version: 8132 · Version from Sept 2017
Students should be expected to manipulate and interpret data from tables…
Full specification wording
The purpose and methods of market research: Students should be expected to manipulate and interpret data from tables and charts.
Market research produces raw figures, and this skill turns them into business meaning.
Checked against the AQA 8132 specification (opens in a new tab) on .
- Point 18 of 19
- 4 key terms
Study notes
From the checked teaching notes for this specification point.
The idea
Market research produces raw figures, and this skill turns them into business meaning. Interpreting means reading a table or chart to state what it shows: for example, a table of monthly sales where January is £12,000 and February is £15,000 shows a rise of £3,000, which is (£3,000 ÷ £12,000) × 100 = 25%. Manipulating means calculating with the data: totals, differences, percentage change, averages or a missing value. Always read the axes, units and labels first, then quote figures with their units, then explain the consequence for the business, such as whether demand is growing. Charts suit trends and comparisons; tables suit precise values.
What earns the marks
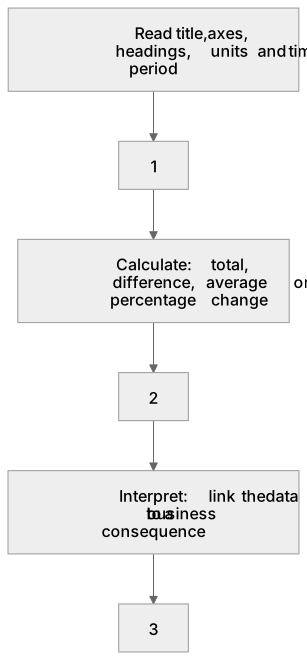
- Reads the title, axes, row and column headings, units and time period before quoting any figure.
- Extracts the correct value from a table or chart and states it with its unit, for example £15,000 or 2,400 units.
- Calculates a difference, total, average or percentage change correctly, showing the working.
- Describes the pattern shown, such as a steady rise, a fall or a peak in one month.
- Interprets the data by linking it to a business consequence, for example rising sales may justify extra stock.
- Compares two sets of data, for example one product's sales against another's, using figures as evidence.
Common mistakes and how to put them right
Quoting a figure without its unit.
Put it right: Write the value with the unit, such as £15,000 or 2,400 units.
Reading the wrong axis or scale on a chart.
Put it right: Check the axis labels and the value of each gridline before reading a point.
Calculating percentage change by dividing the difference by the new value.
Put it right: Divide the difference by the original value and multiply by 100.
Exam tips
- Underline the command word first: interpret questions need description plus meaning, while calculate questions need working and a unit.
- Show each step of a calculation so method marks can be awarded even if the final figure is wrong.
- When asked to interpret, always add a business consequence rather than stopping at the number.
Try the lesson
The start of the The purpose and methods of market research: Students should be expected to manipulate and interpret data from tables and charts. lesson, made from checked teaching notes for this specification point.
Have a go first
A market research table shows the number of customers visiting a shop each day: Monday 40, Tuesday 55, Wednesday 35. What is the total number of customers over these three days?
Listen
Market research produces raw figures, and this skill turns them into business meaning. Interpreting means reading a table or chart to state what it shows: for example, a table of monthly sales where January is £12,000 and February is £15,000 shows a rise of £3,000, which is (£3,000 ÷ £12,000) × 100 = 25%. Manipulating means calculating with the data: totals, differences, percentage change, averages or a missing value. Always read the axes, units and labels first, then quote figures with their units, then explain the consequence for the business, such as whether demand is growing. Charts suit trends and comparisons; tables suit precise values. A strong answer earns marks for these points. Reads the title, axes, row and column headings, units and time period before quoting any figure. Extracts the correct value from a table or chart and states it with its unit, for example £15,000 or 2,400 units. Calculates a difference, total, average or percentage change correctly, showing the working. Describes the pattern shown, such as a steady rise, a fall or a peak in one month. A common slip: Quoting a figure without its unit. Instead, write the value with the unit, such as £15,000 or 2,400 units. Exam tip: Underline the command word first: interpret questions need description plus meaning, while calculate questions need working and a unit.
See it
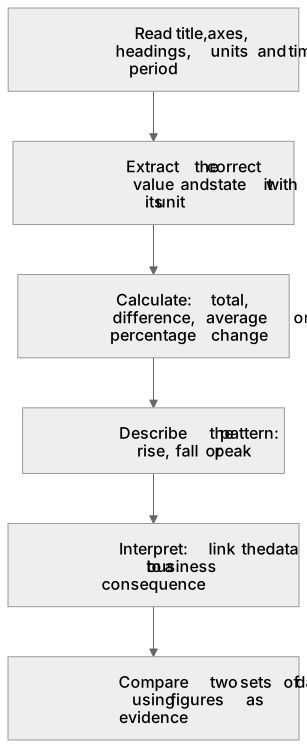
Put it in order
Put these steps in the order they happen.
- 1. Calculate: total, difference, average or percentage change
- 2. Extract the correct value and state it with its unit
- 3. Read title, axes, headings, units and time period
- 4. Compare two sets of data using figures as evidence
- 5. Interpret: link the data to a business consequence
- 6. Describe the pattern: rise, fall or peak
Key words
Say what each word means before you turn the card.
Data interpretation
Try answering aloud or in your head before turning the card.
Calculation skills
Try answering aloud or in your head before turning the card.
Evidence-based conclusions
Try answering aloud or in your head before turning the card.
Business decision making
Try answering aloud or in your head before turning the card.
See every definition
- Data interpretation
- Reading a table or chart to state what it shows, then explaining the consequence for the business, such as whether demand is growing.
- Calculation skills
- Calculating with the data, such as totals, differences, percentage change, averages or a missing value, showing the working.
- Evidence-based conclusions
- Interpreting the data by linking it to a business consequence, using figures as evidence, for example rising sales may justify extra stock.
- Business decision making
- Explaining what the data suggests for the business, adding a business consequence rather than stopping at the number.
Label the diagram
Some boxes have lost their names. Pick the right name for each number.
1Box 1
2Box 2
3Box 3
There is more to this lesson
The full lesson goes on to check your understanding and help you earn the marks. Create a free account to carry on, with your progress saved.
A week of Premium from your first lesson · Then the free plan continues · No card, no charge
Test your understanding of The purpose and methods of market research: Students should be expected to manipulate and interpret data from tables and charts.
Active recall beats re-reading. Take an instant quiz now to test what you’ve learned and lock it into long-term memory.
A week of Premium from your first lesson · Then the free plan continues · No card, no charge