Pearson Edexcel · A-Level · Business
Managing finance
Mastering the financial health of a business is crucial for GCSE success. This study guide unpacks the essential calculations for profit and liquidity, whilst explaining the critical difference between profit and cash flow that catches so many candidates out.
- 6 min read
- 3 worked examples
- 5 practice questions
- 6 key terms
Study Notes

Overview
This topic covers the fundamental concepts of managing business finance. Examiners expect candidates to not only perform calculations accurately but also to interpret what these figures mean for the health and survival of a business. You must be able to calculate three levels of profit (gross, operating, and profit for the year), assess liquidity using the current and acid test ratios, and evaluate the internal and external causes of business failure. A key discriminator for higher grades is the ability to clearly distinguish between profit (an accounting concept) and cash (physical money), as confusing the two is a very common pitfall.
1. Measuring Profitability
Profit is the financial reward for taking risks and running a business. It is calculated in three stages, each revealing a different level of financial performance.
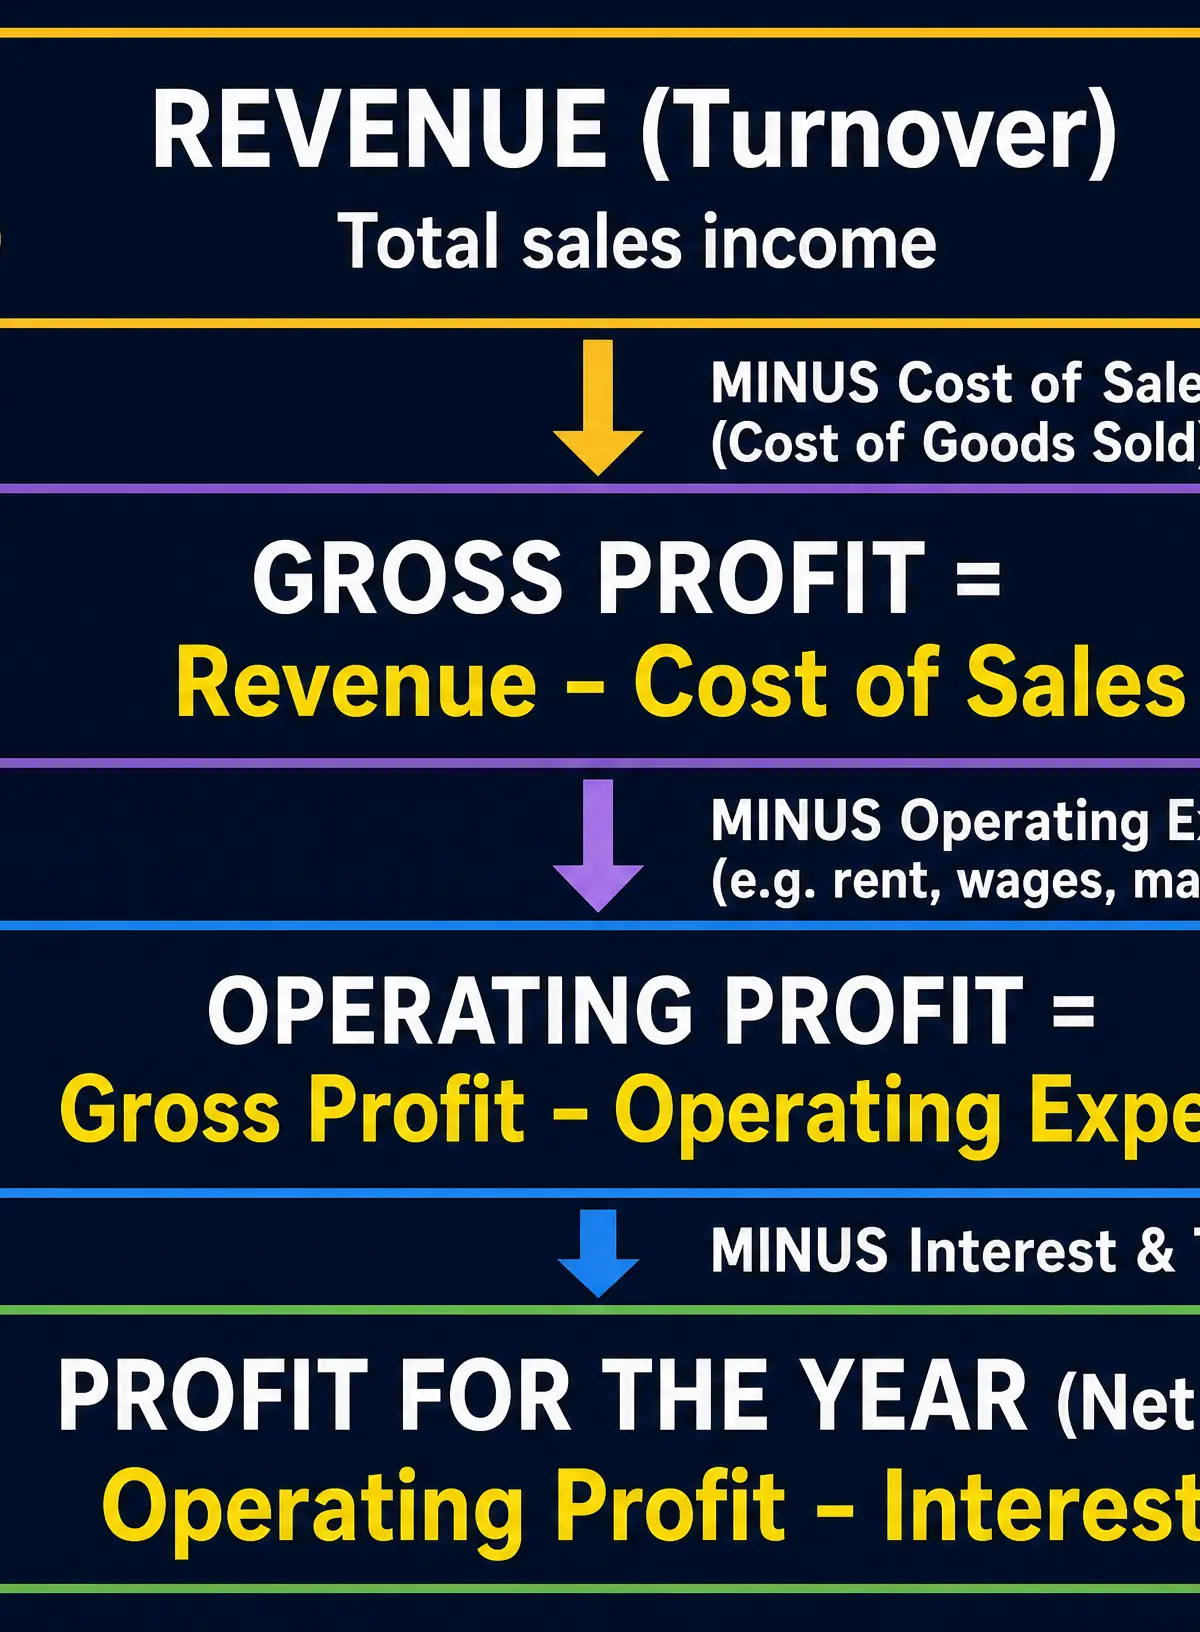
The Three Levels of Profit
- Gross Profit: The profit made after covering the direct costs of making or buying the product.
- Formula: Revenue - Cost of Sales
- Operating Profit: The profit made after deducting the day-to-day running costs (overheads) of the business.
- Formula: Gross Profit - Operating Expenses
- Profit for the Year (Net Profit): The final profit figure after all costs, including interest on loans and tax, have been paid.
- Formula: Operating Profit - Interest - Tax
Profit Margins
Examiners often ask you to calculate profit margins. These show what percentage of revenue is converted into profit, making it easier to compare performance over time or against competitors.
- Gross Profit Margin (%): (Gross Profit ÷ Revenue) × 100
- Operating Profit Margin (%): (Operating Profit ÷ Revenue) × 100
- Profit for the Year Margin (%): (Profit for the Year ÷ Revenue) × 100
Ways to Improve Profitability
To improve profitability, a business must either increase revenue or decrease costs.
- Increase Revenue: Raise prices (if demand is inelastic), increase marketing to boost sales volume, or introduce new products.
- Decrease Costs: Negotiate cheaper supplies, reduce staffing costs, or improve production efficiency.
- Evaluation Point: Every strategy has a trade-off. Using cheaper materials might reduce the cost of sales, but it could also lower product quality, damage the brand reputation, and ultimately lead to a fall in revenue.
2. Profit vs. Cash
This is a critical distinction. Profit and cash are not the same thing.
- Profit is recorded when a sale is made, regardless of whether the customer has paid yet.
- Cash is the physical money moving into and out of the business (cash flow).
A business can be highly profitable on paper but still fail if it runs out of cash. For example, if a business offers long credit terms to its customers (e.g., 60 days to pay), it records the profit immediately. However, if it must pay its suppliers and staff within 30 days, it will experience a negative cash flow and may not be able to pay its bills, leading to insolvency.
3. Measuring Liquidity
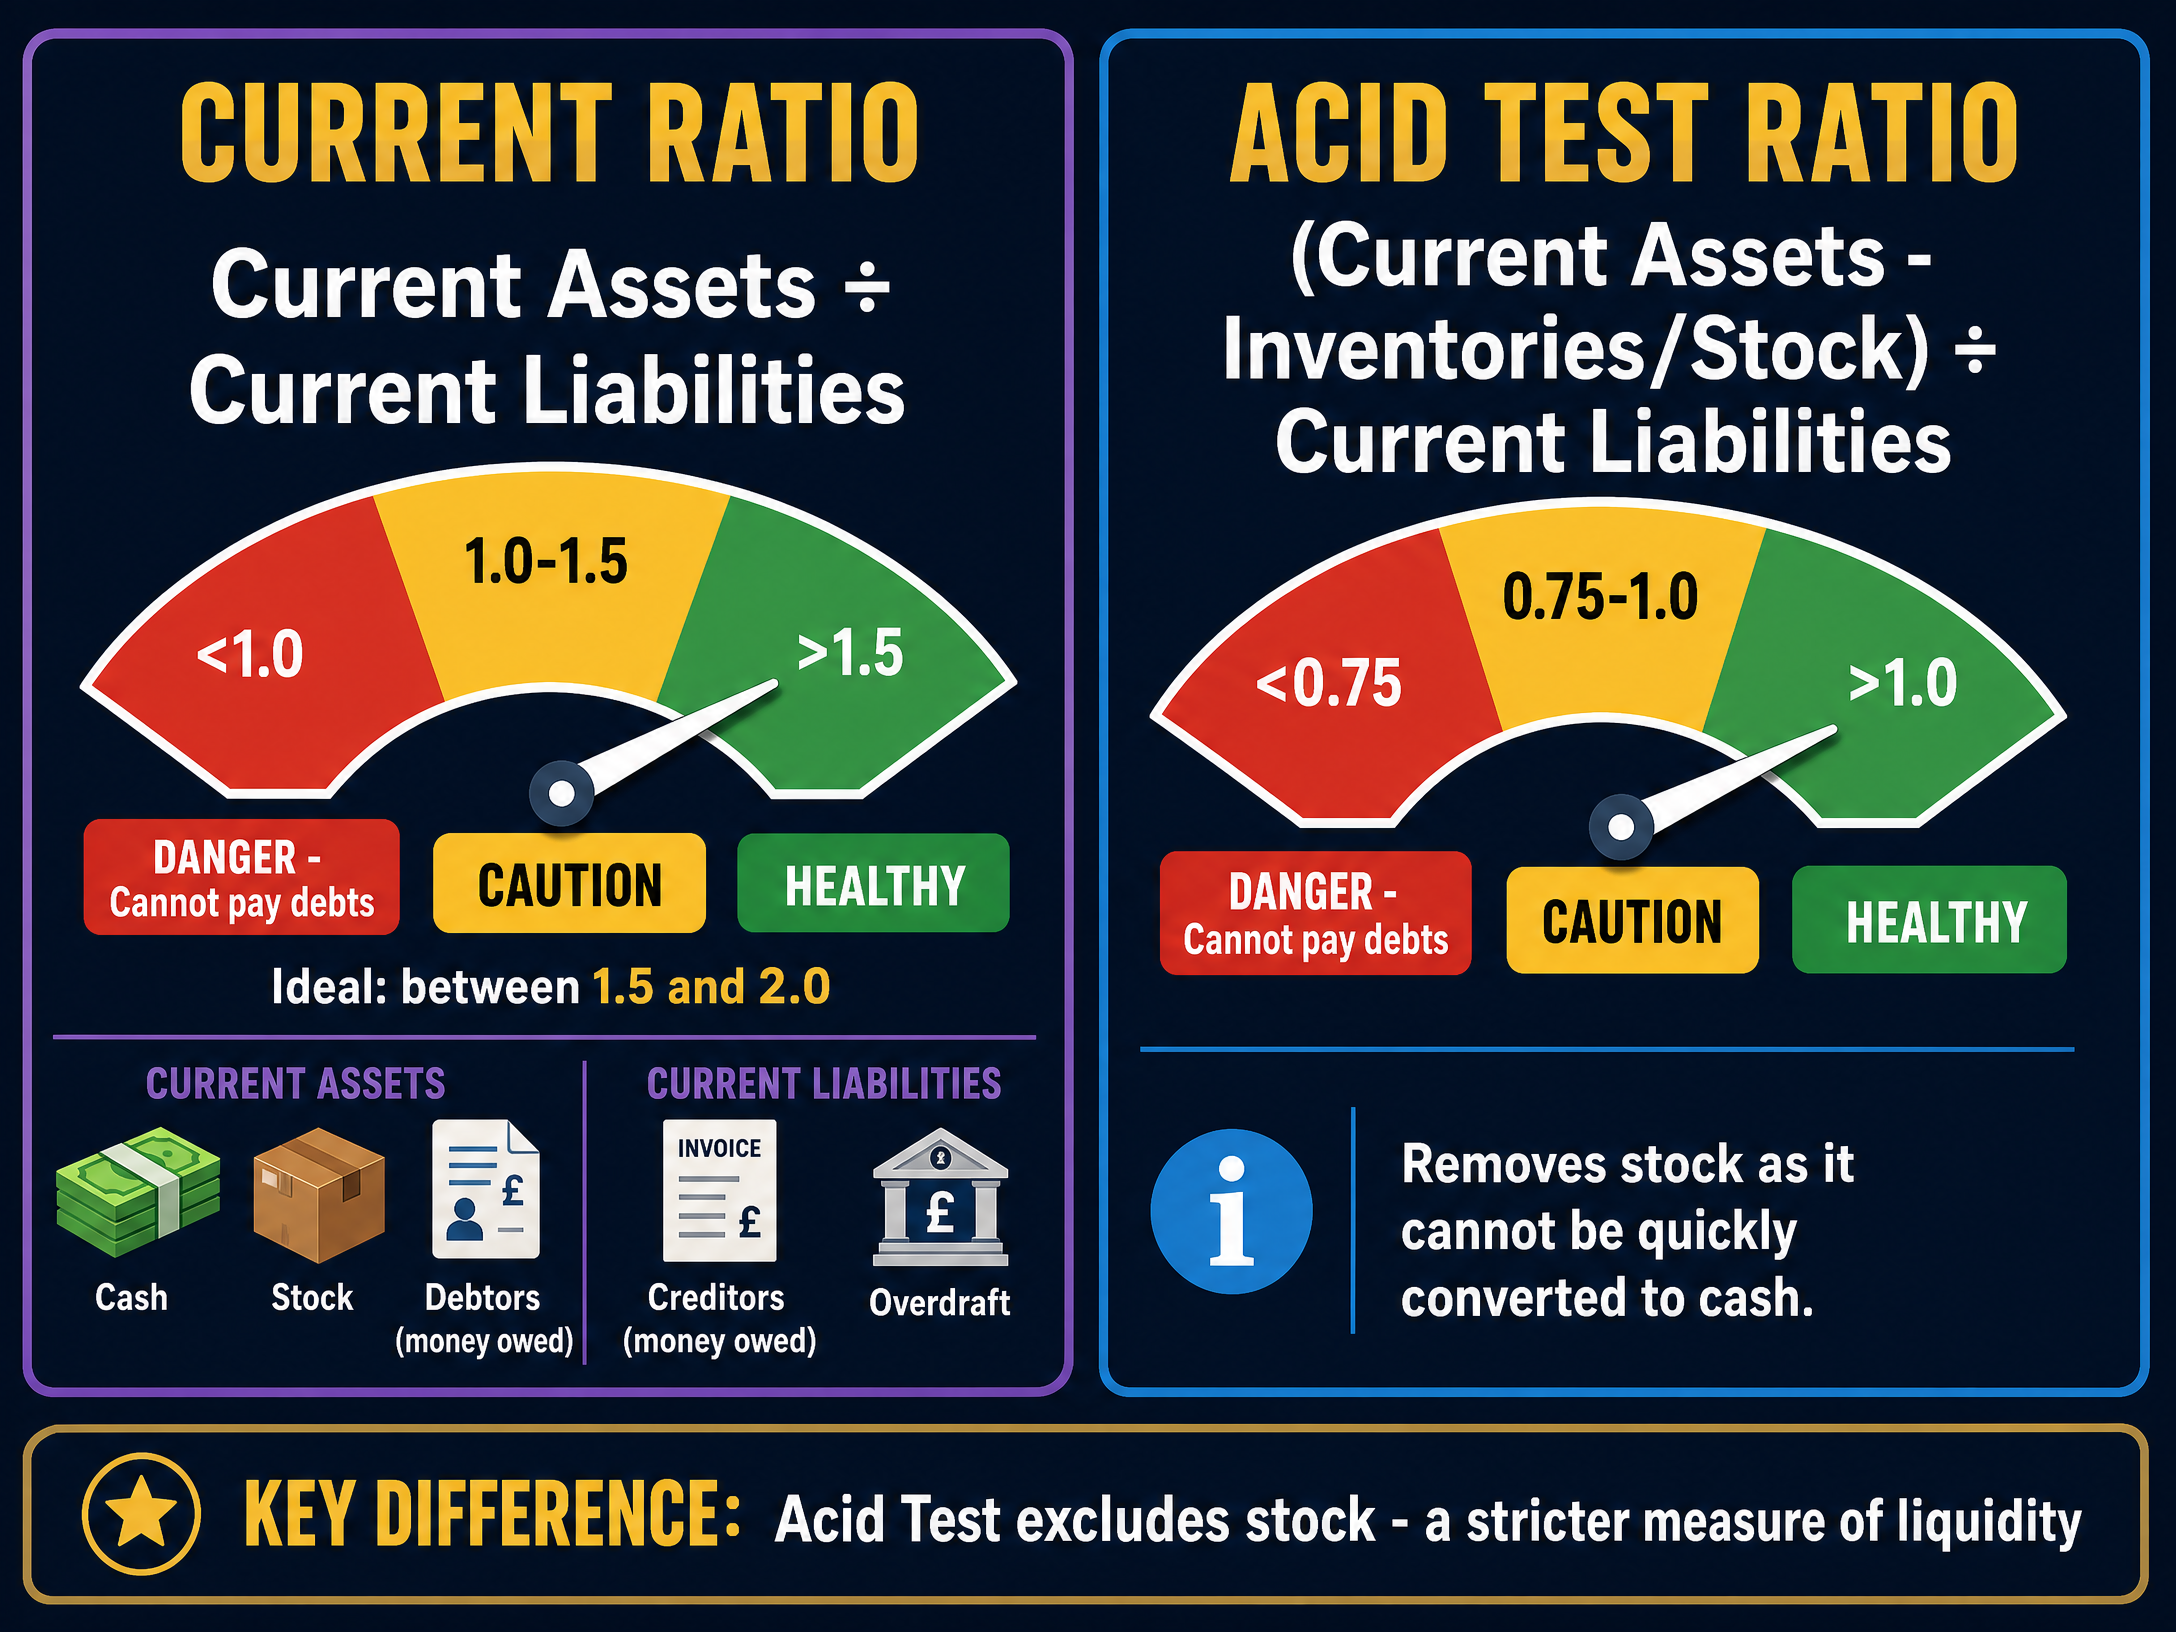
Liquidity measures a business's ability to pay its short-term debts. It assesses whether the business has enough current assets (cash, stock, debtors) to cover its current liabilities (creditors, overdrafts).
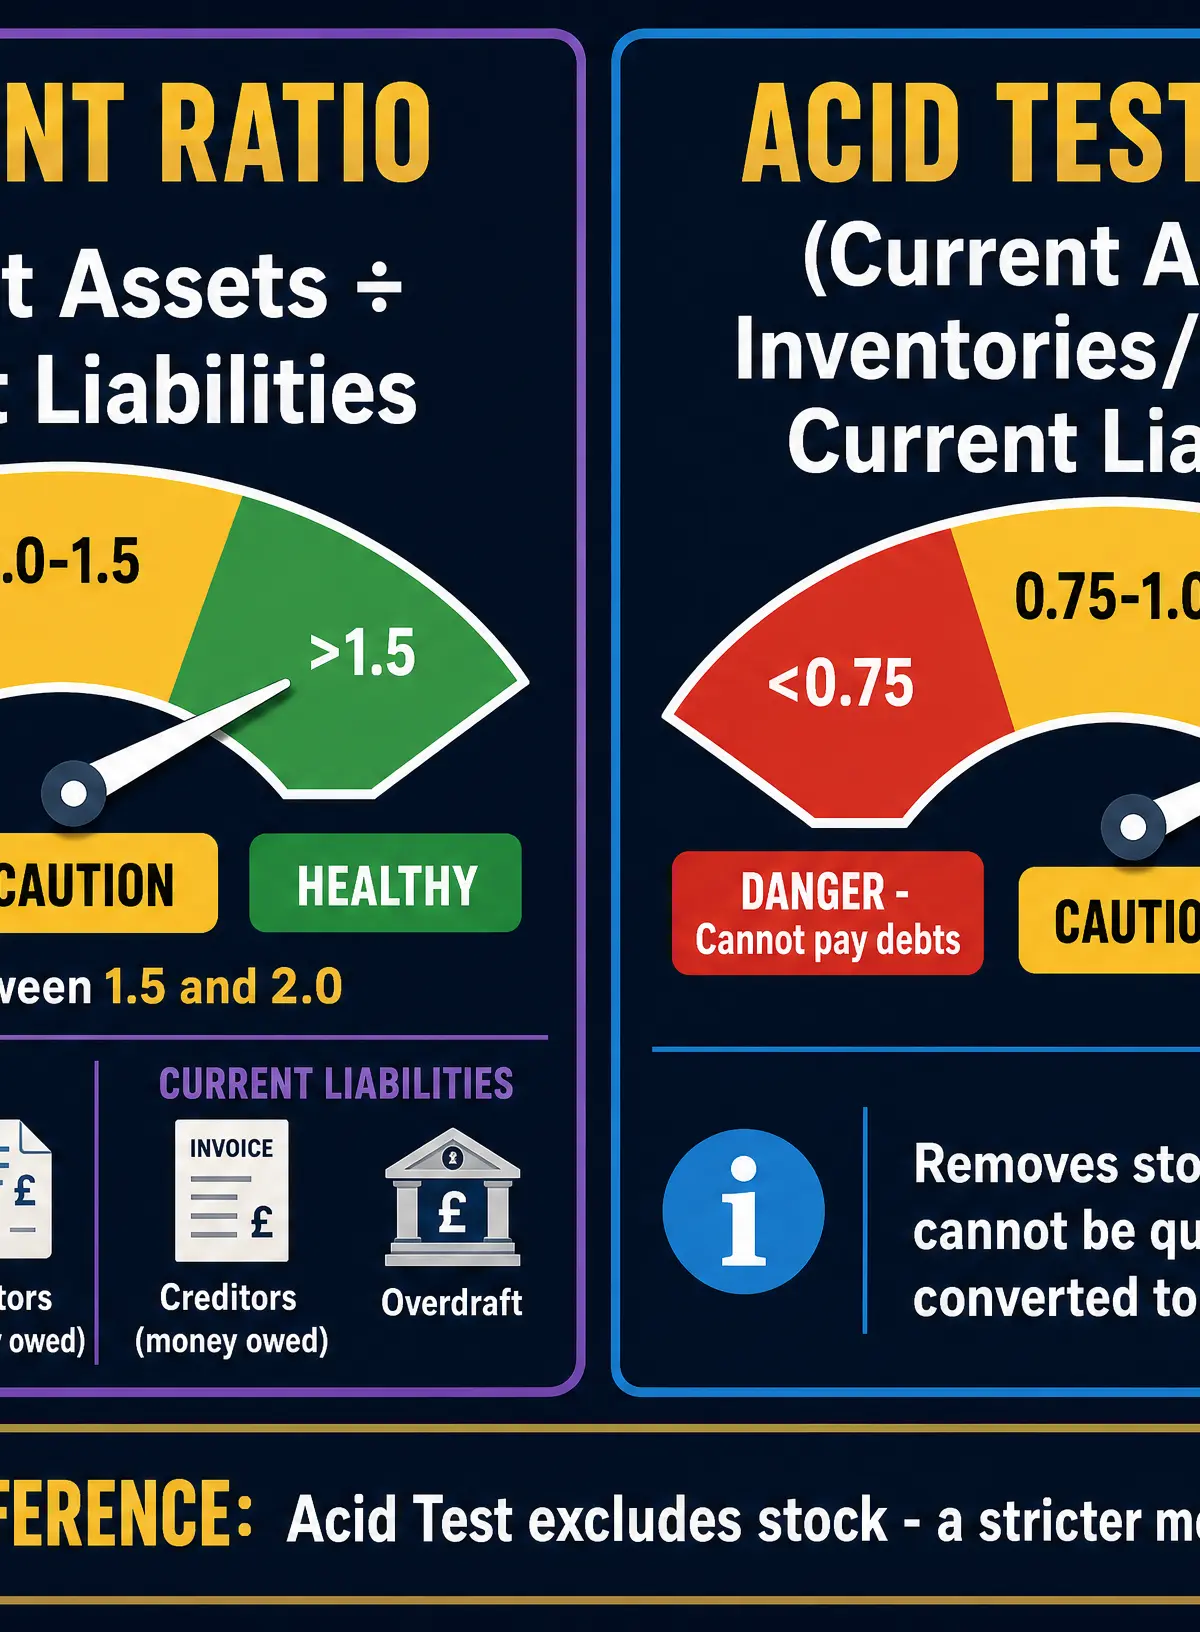
The Two Liquidity Ratios
- Current Ratio: Measures whether a business has enough current assets to cover its current liabilities.
- Formula: Current Assets ÷ Current Liabilities
- Interpretation: An ideal ratio is between 1.5:1 and 2:1. A ratio below 1:1 means the business cannot cover its short-term debts and is facing severe liquidity problems.
- Acid Test Ratio: A stricter measure of liquidity that excludes stock, because stock is the hardest current asset to turn quickly into cash.
- Formula: (Current Assets - Inventories) ÷ Current Liabilities
- Interpretation: An ideal ratio is 1:1 or higher. If the ratio is below 1:1, the business relies heavily on selling its stock to pay its immediate debts.
Ways to Improve Liquidity
- Sell unused fixed assets (e.g., machinery) to raise cash.
- Reduce stock levels (JIT production) to free up cash tied up in inventory.
- Chase debtors (customers who owe money) to pay more quickly.
- Negotiate longer credit terms with suppliers (creditors).
- Arrange a short-term bank loan or extend an overdraft facility.
4. Working Capital and Business Failure
Working Capital is the money available for the day-to-day running of the business.
- Formula: Current Assets - Current Liabilities.
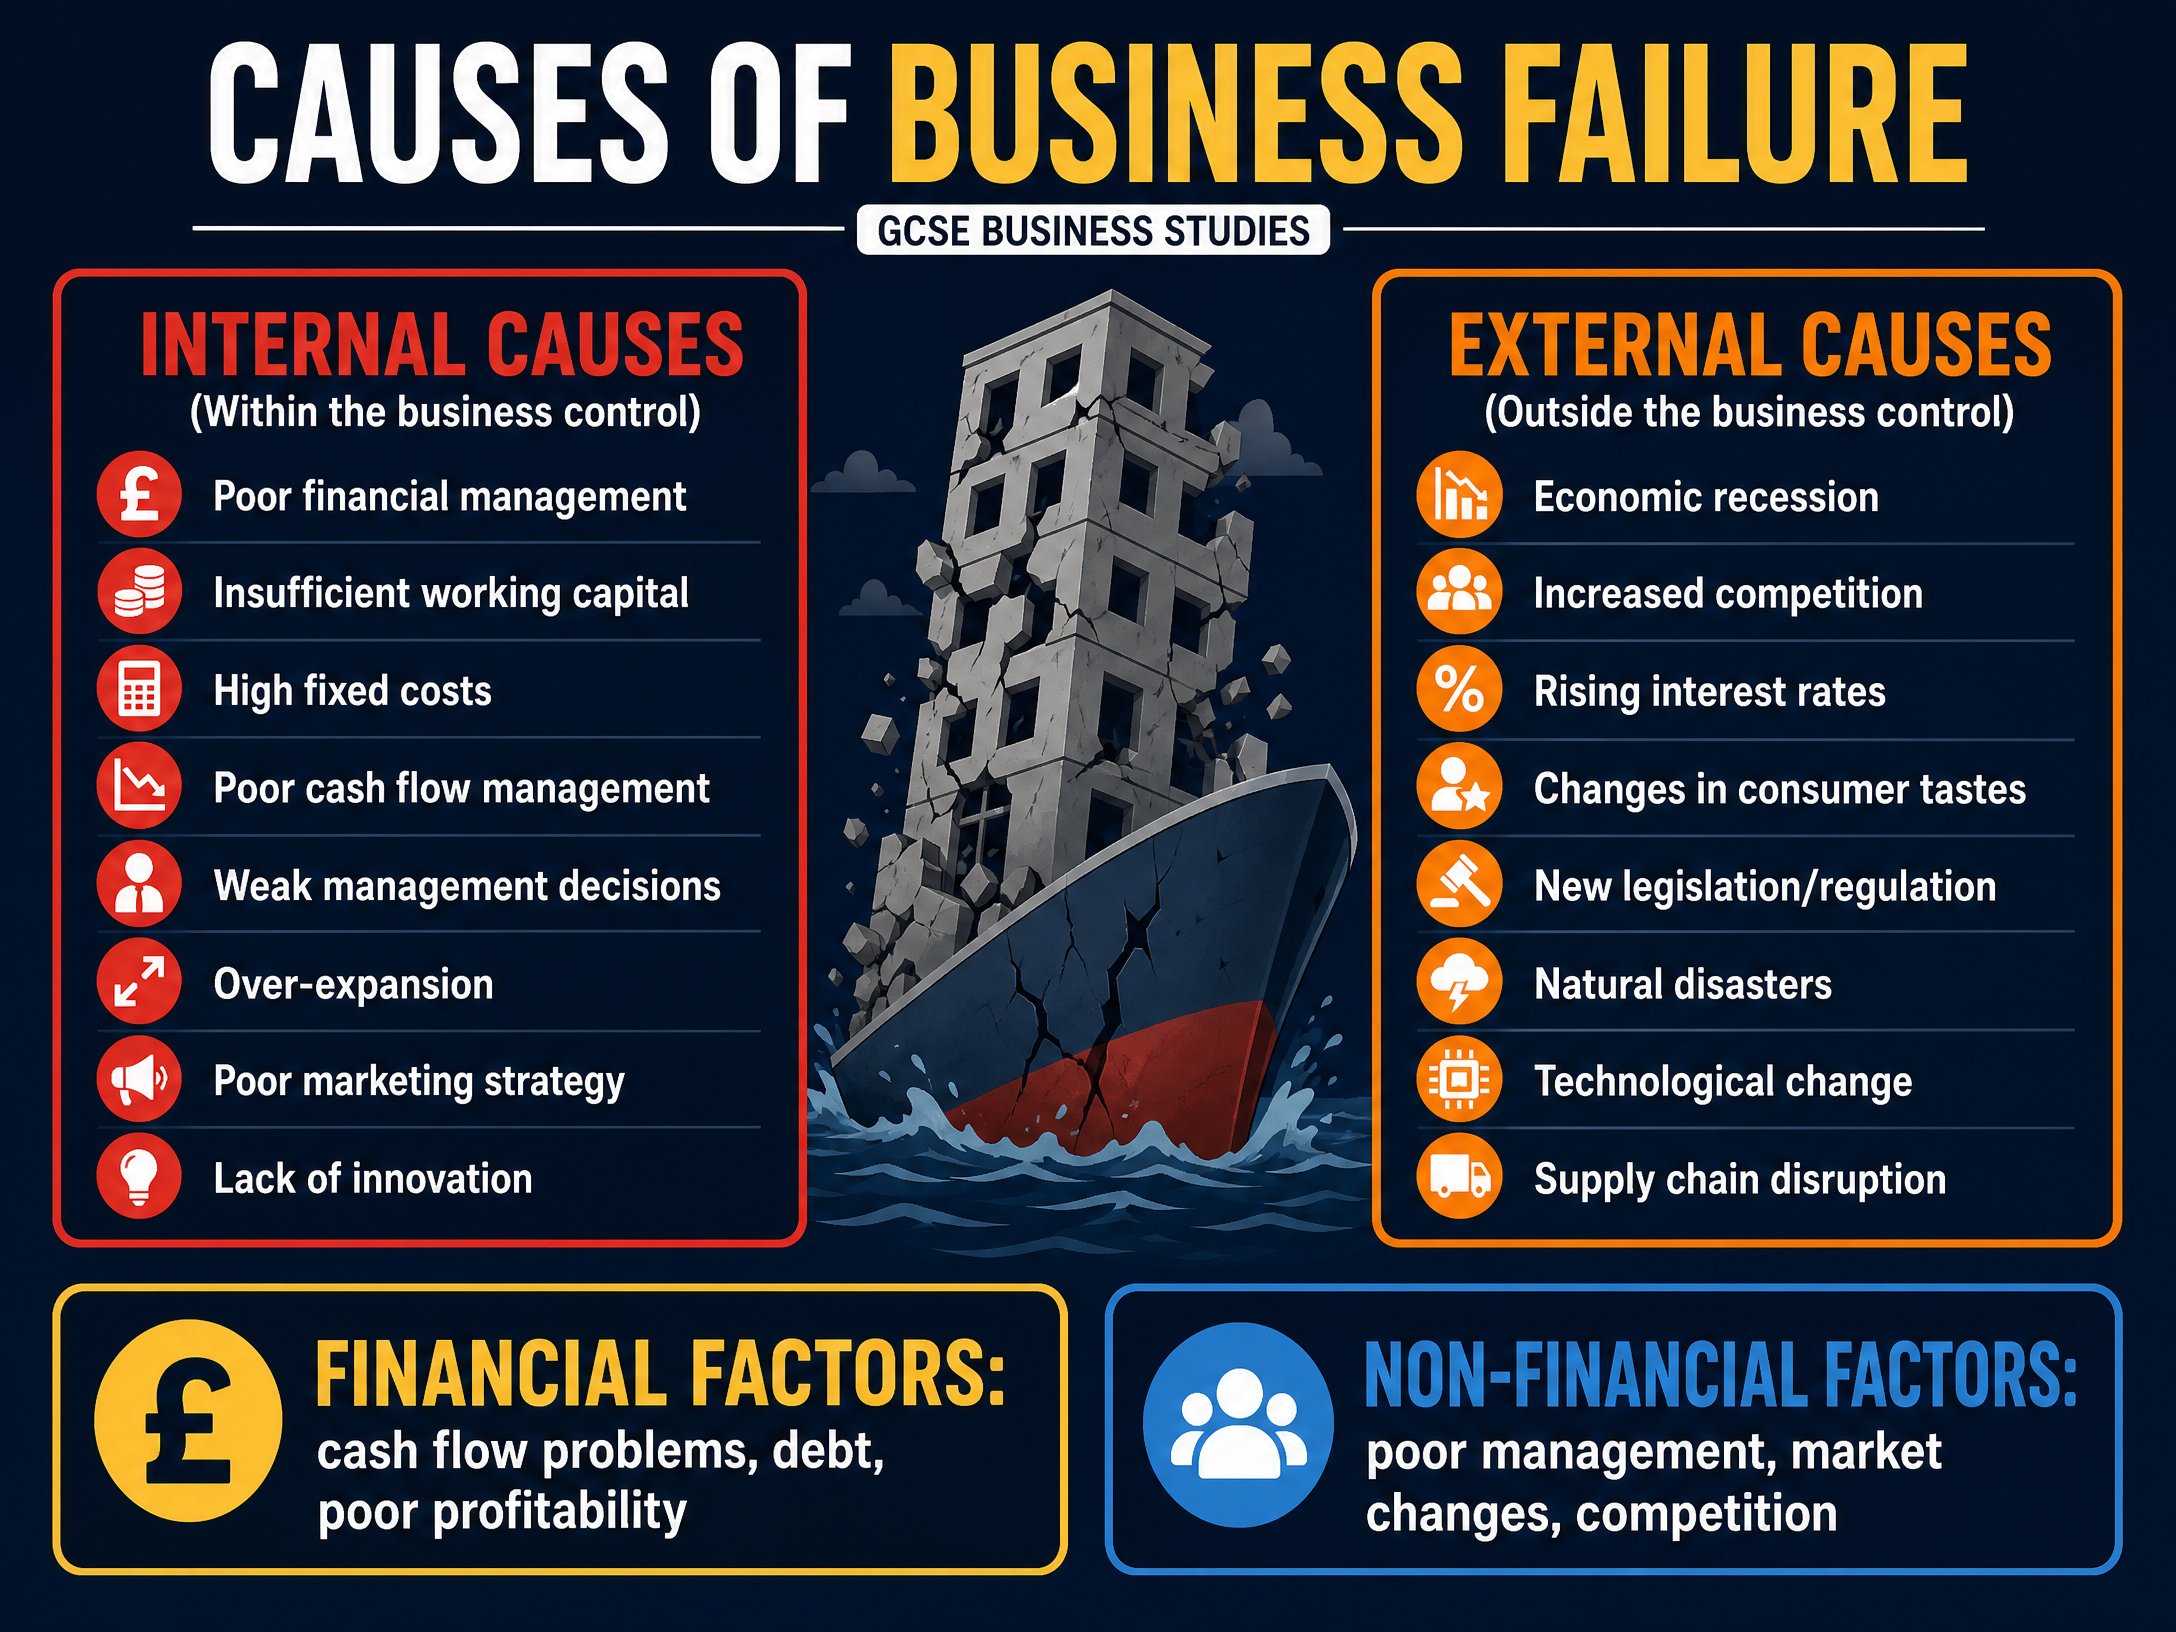
If a business lacks sufficient working capital, it may fail. Examiners require you to distinguish between internal and external causes of failure.
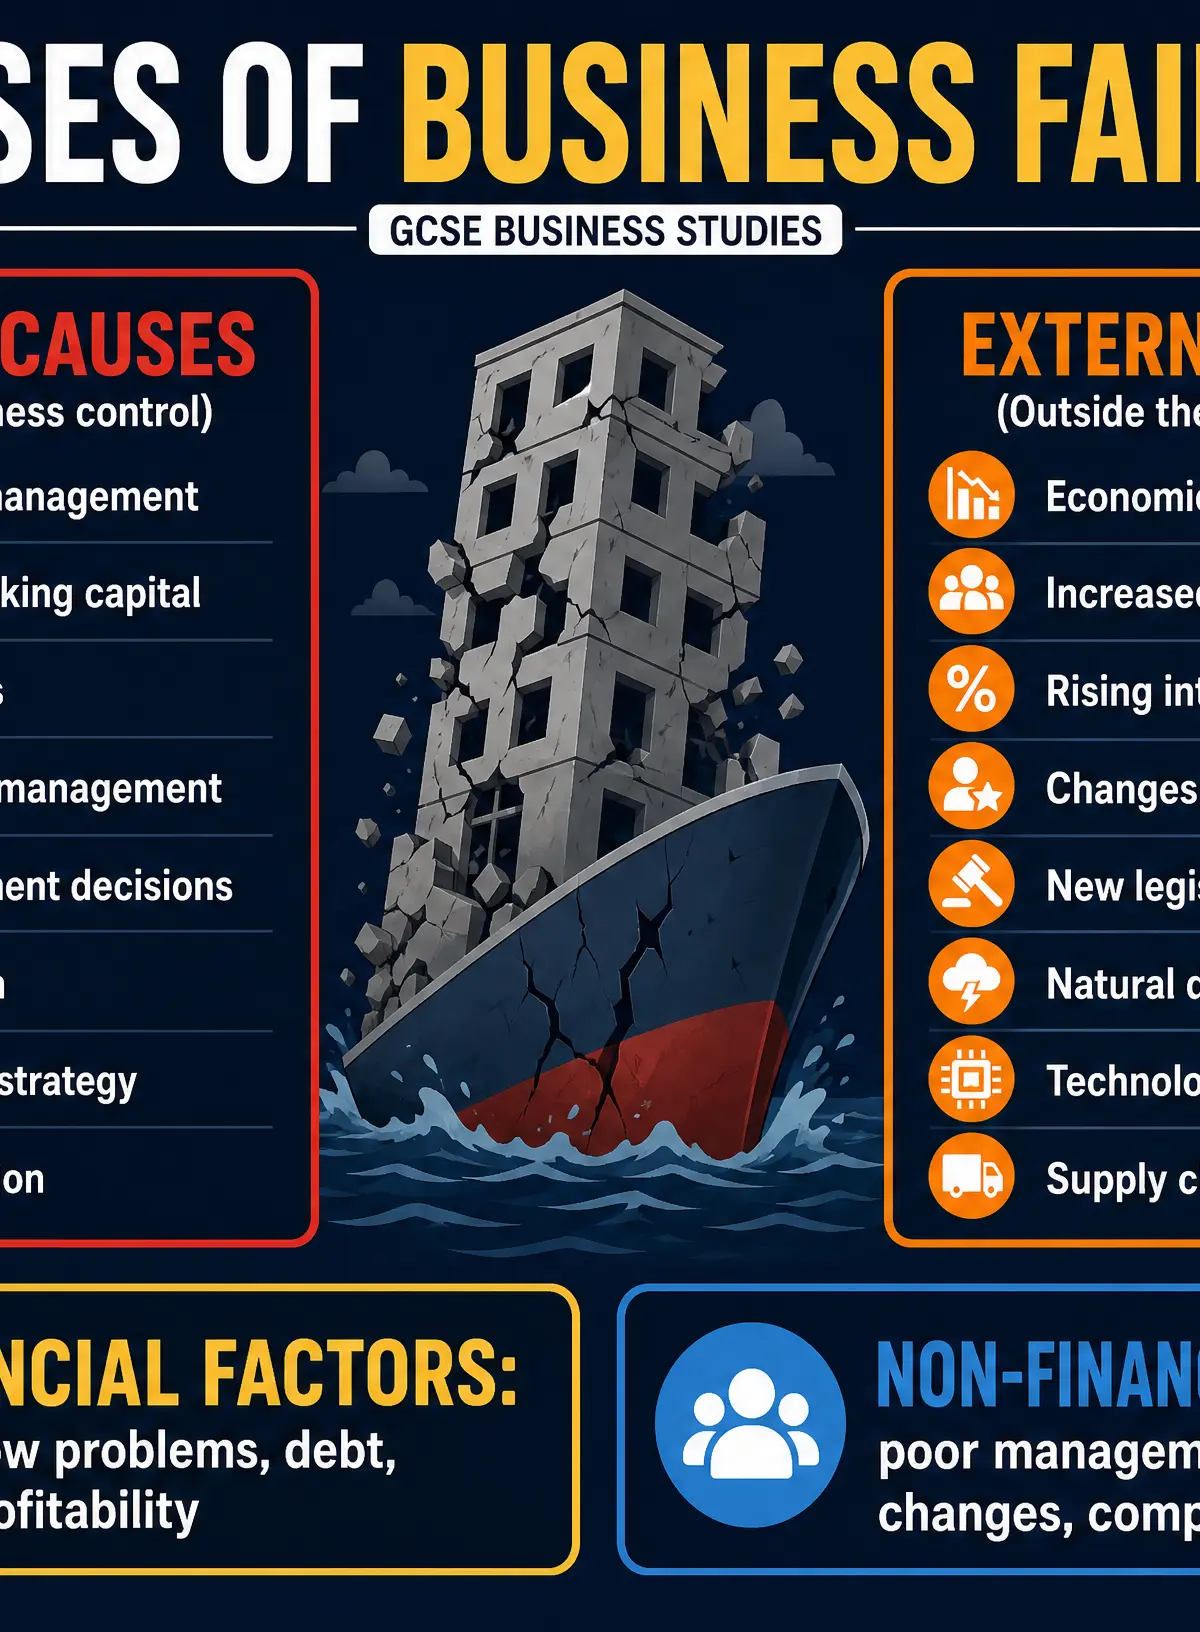
Causes of Business Failure
Internal Causes (within the business's control):
- Poor financial management (e.g., poor cash flow forecasting)
- Over-expansion (growing too fast without sufficient capital)
- Poor marketing strategy or failure to innovate
- High fixed costs
External Causes (outside the business's control):
- Economic recession (leading to lower consumer spending)
- Increased competition
- Changes in consumer tastes or trends
- New legislation or government regulations
Audio Revision
Listen to our comprehensive 10-minute podcast covering all these topics, perfect for revising on the go:

Visual Resources
3 diagrams and illustrations
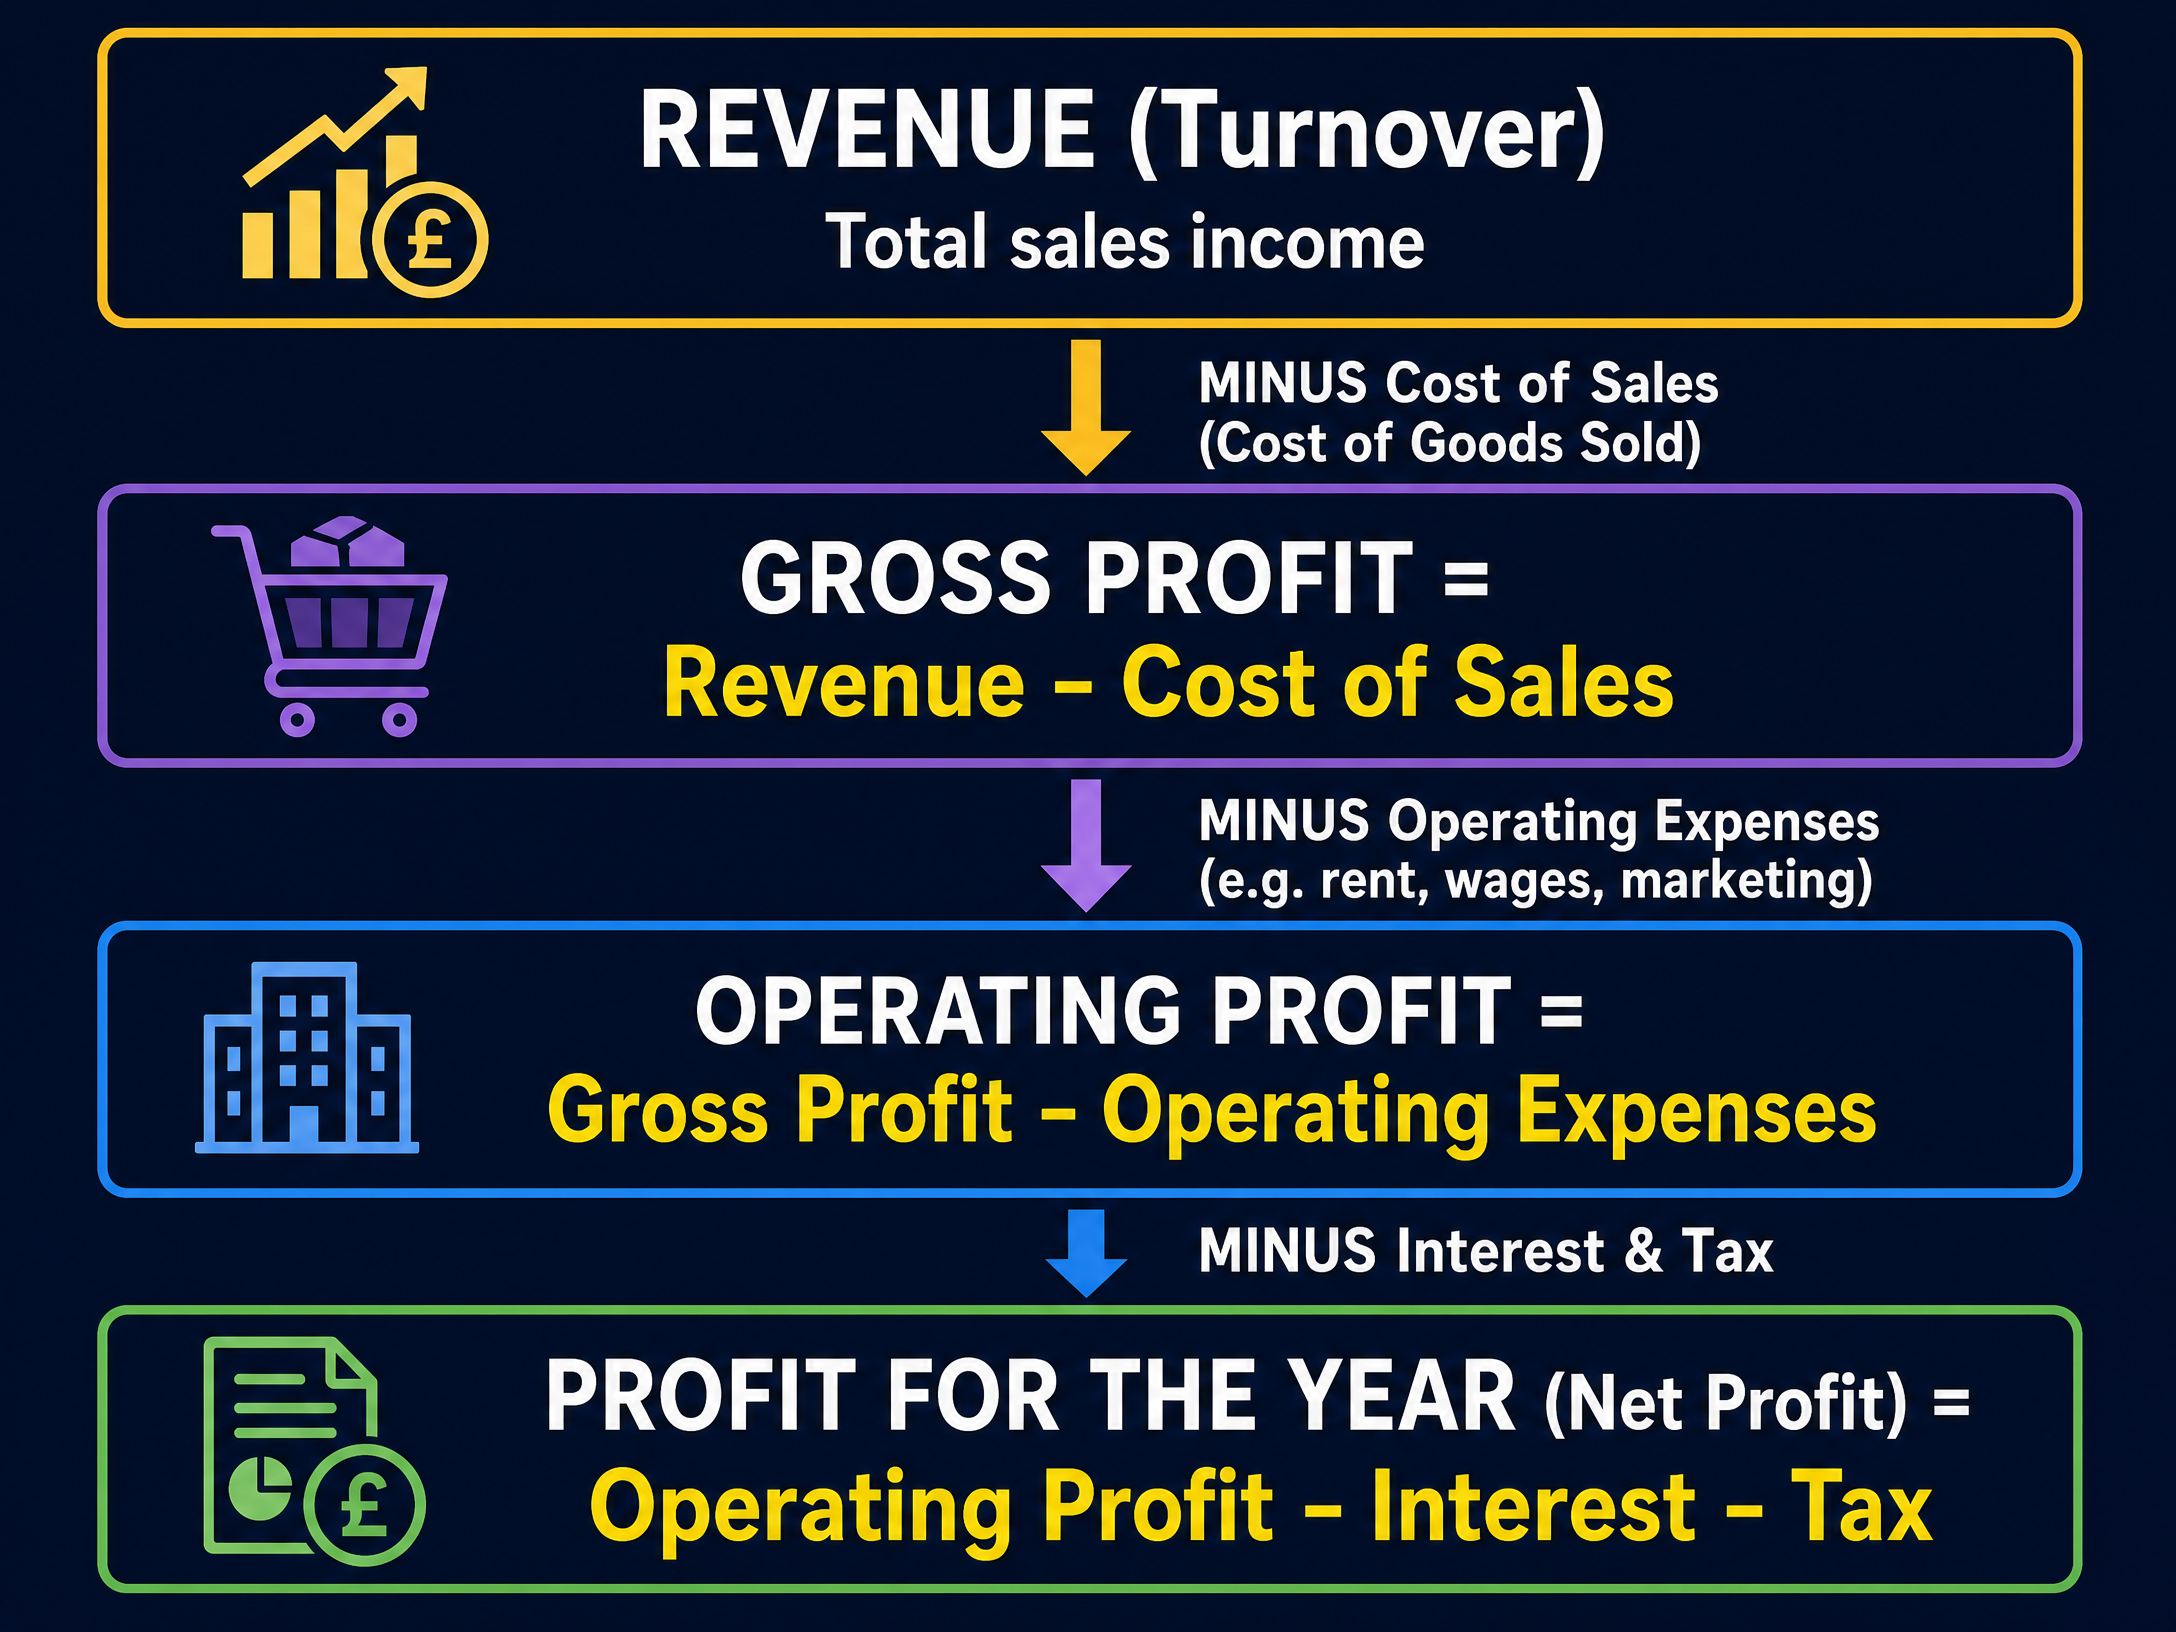
Interactive Diagrams
1 interactive diagram to visualise key concepts
Conceptual Flow Outline
The stages of profit calculation
Worked Examples
3 worked examples — open one to explore the question and available guidance.
Practice Questions
Test your understanding — click to reveal model answers
A business has Current Assets of £120,000 (including £40,000 of stock) and Current Liabilities of £80,000. Calculate the Acid Test Ratio. (3 marks)
Hint: Remember to subtract the stock from the current assets before dividing by the liabilities.
Explain the difference between profit and cash. (4 marks)
Hint: Think about when a sale is recorded versus when the money actually arrives.
Analyse two internal causes of business failure. (6 marks)
Hint: Ensure you pick factors the business can control, and explain exactly how they lead to failure.
State the formula for calculating the Gross Profit Margin. (1 mark)
Hint: It's a percentage, so remember what you multiply by at the end.
Explain one reason why a business might have a healthy Current Ratio but a poor Acid Test Ratio. (3 marks)
Hint: Look at the difference in the formulas for the two ratios.