OCR · GCSE · Business
Break-Even Analysis
This study guide for OCR GCSE Business provides a comprehensive breakdown of Break-Even Analysis, a critical tool for understanding business viability. It covers the core calculations, chart construction, and evaluative skills needed to secure top marks.
- 4 min read
- 3 worked examples
- 5 practice questions
- 6 key terms
Study Notes
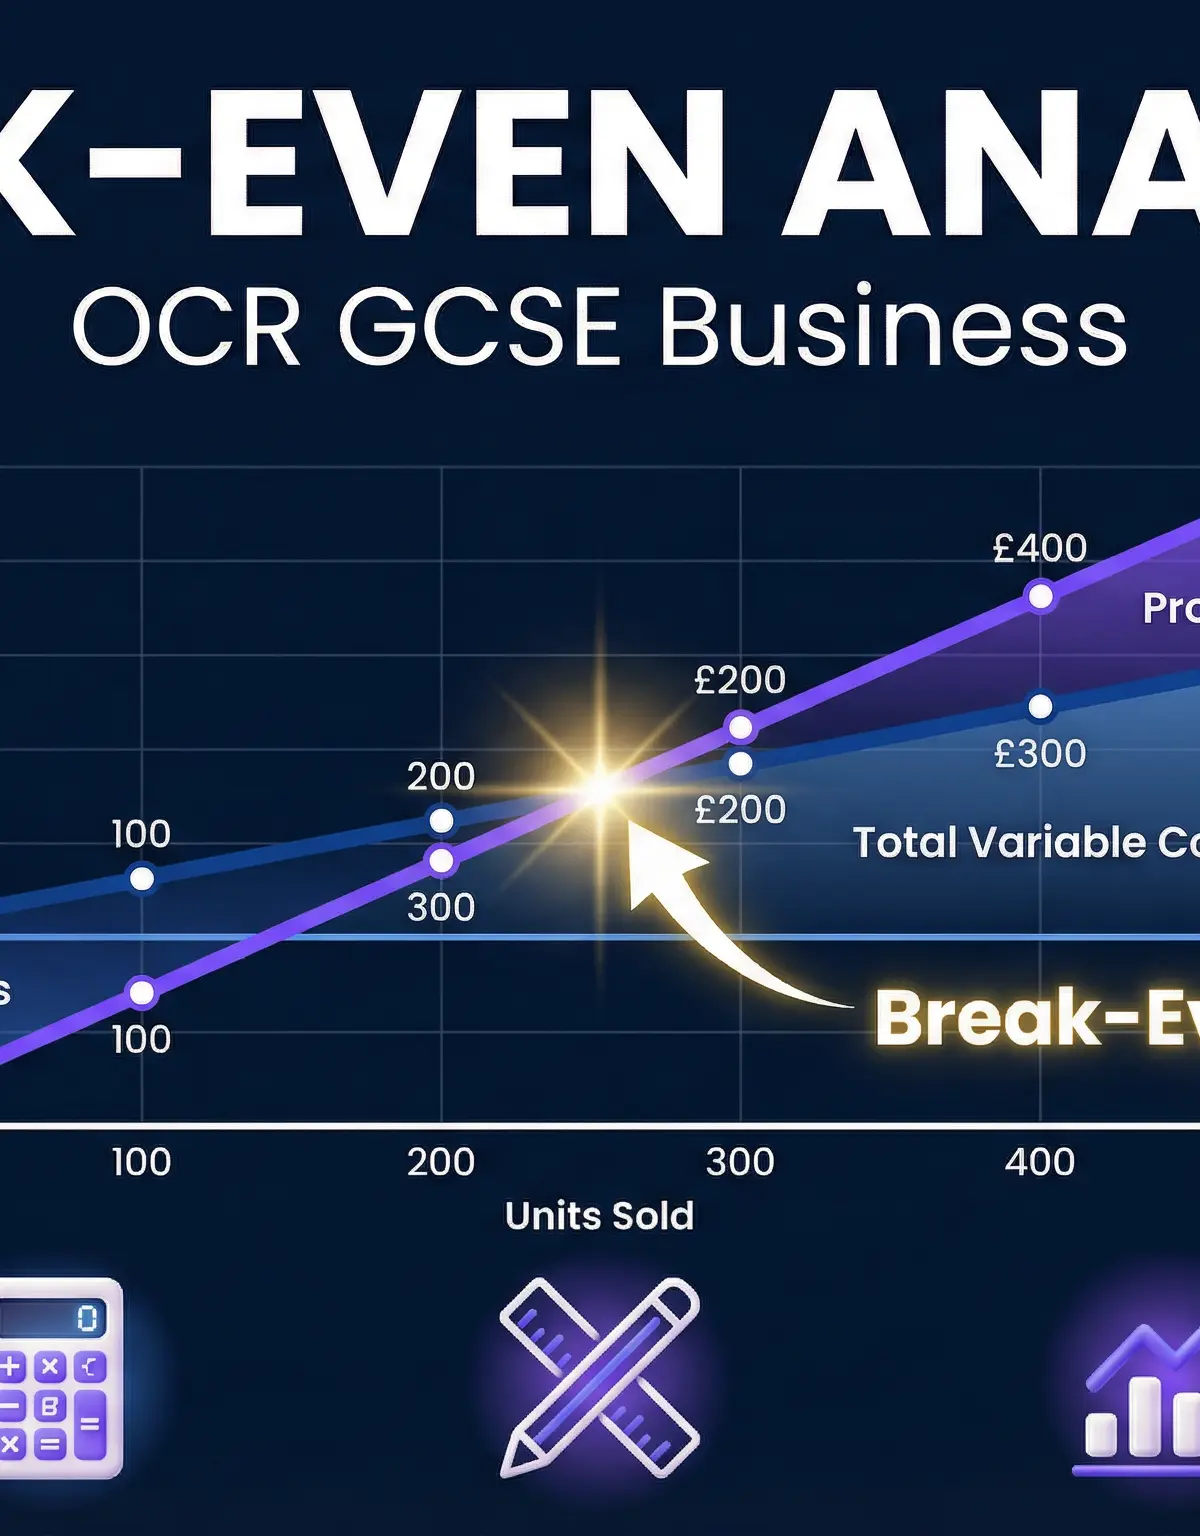
Overview
Break-Even Analysis is a fundamental concept in business management, and for OCR J204, it is a topic that requires both quantitative precision and qualitative evaluation. This guide will equip you with the skills to calculate the break-even point, construct and interpret break-even charts, and critically assess the model's limitations. Examiners expect candidates to not only perform the calculations accurately but also to apply the concepts to various business scenarios, analysing the impact of changing variables on profitability and risk. Mastering this topic is essential for demonstrating a strong grasp of financial decision-making.

Key Concepts
Fixed, Variable, and Total Costs
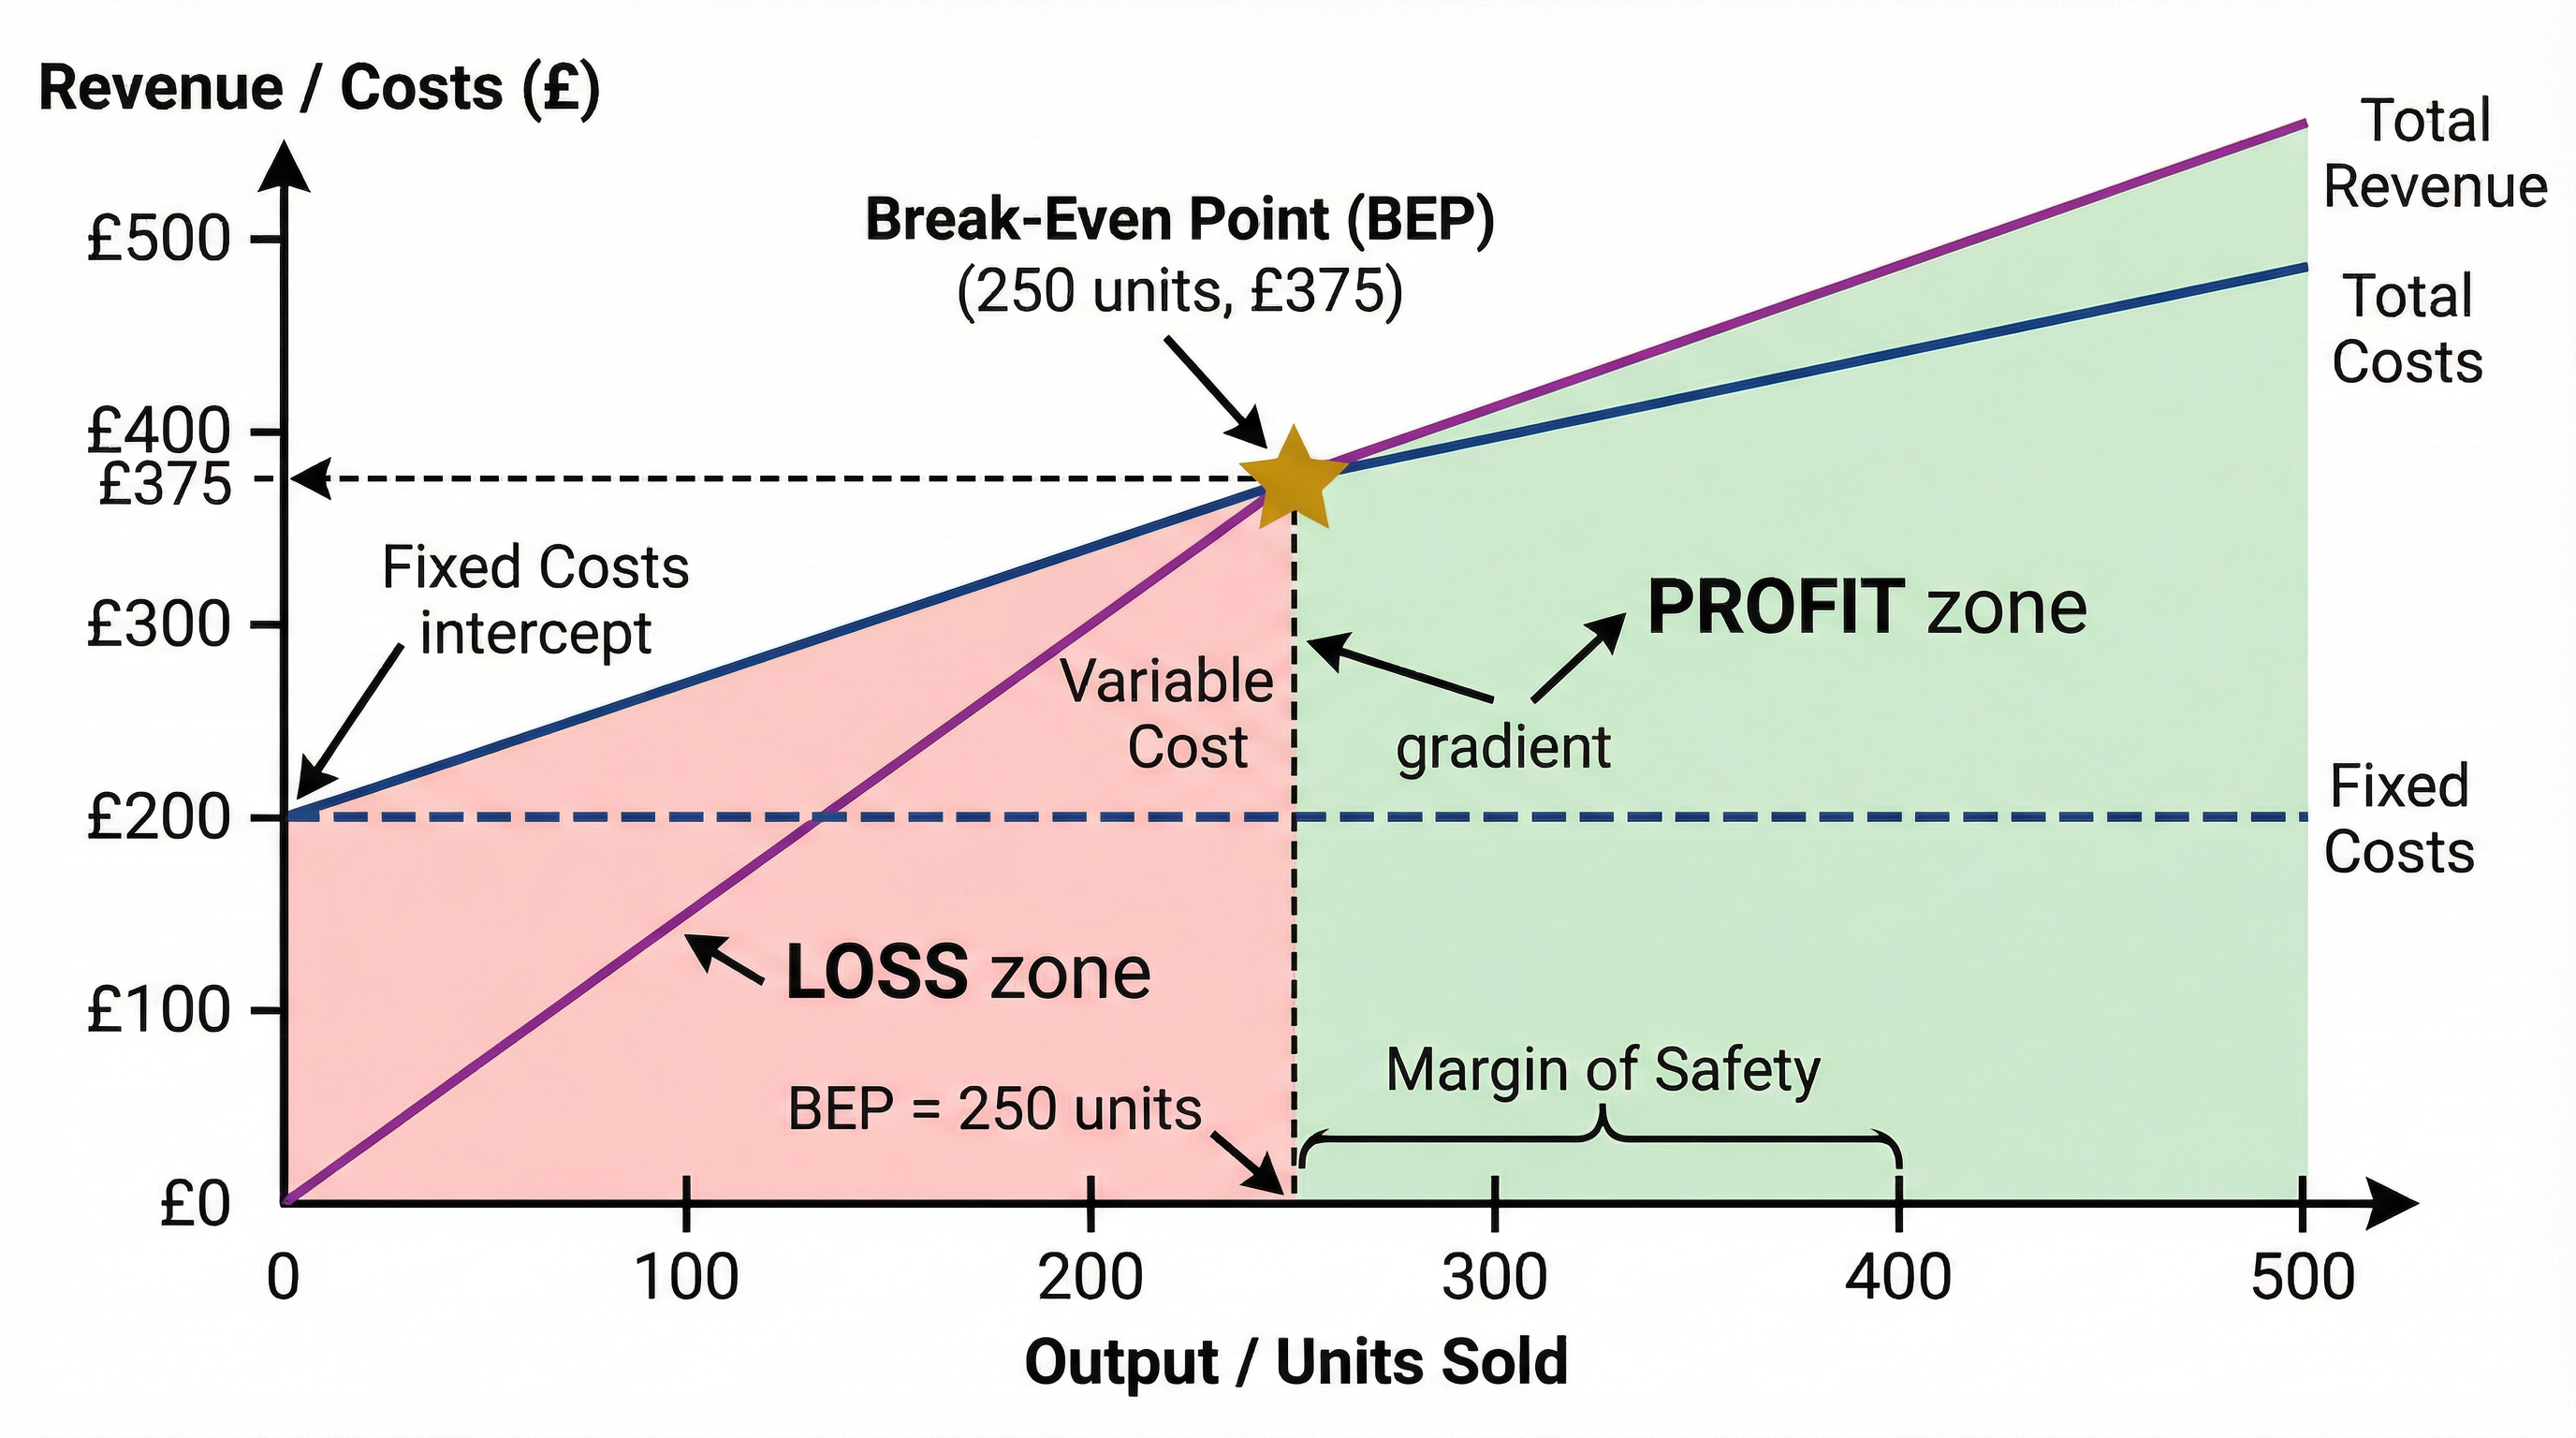
Fixed Costs (FC): These are costs that do not change with the level of output. Examples include rent, insurance, and salaries. On a break-even chart, this is a horizontal line.
Variable Costs (VC): These costs vary directly with the level of output. Examples include raw materials, packaging, and direct labour. Total Variable Costs = Variable Cost per Unit x Quantity.
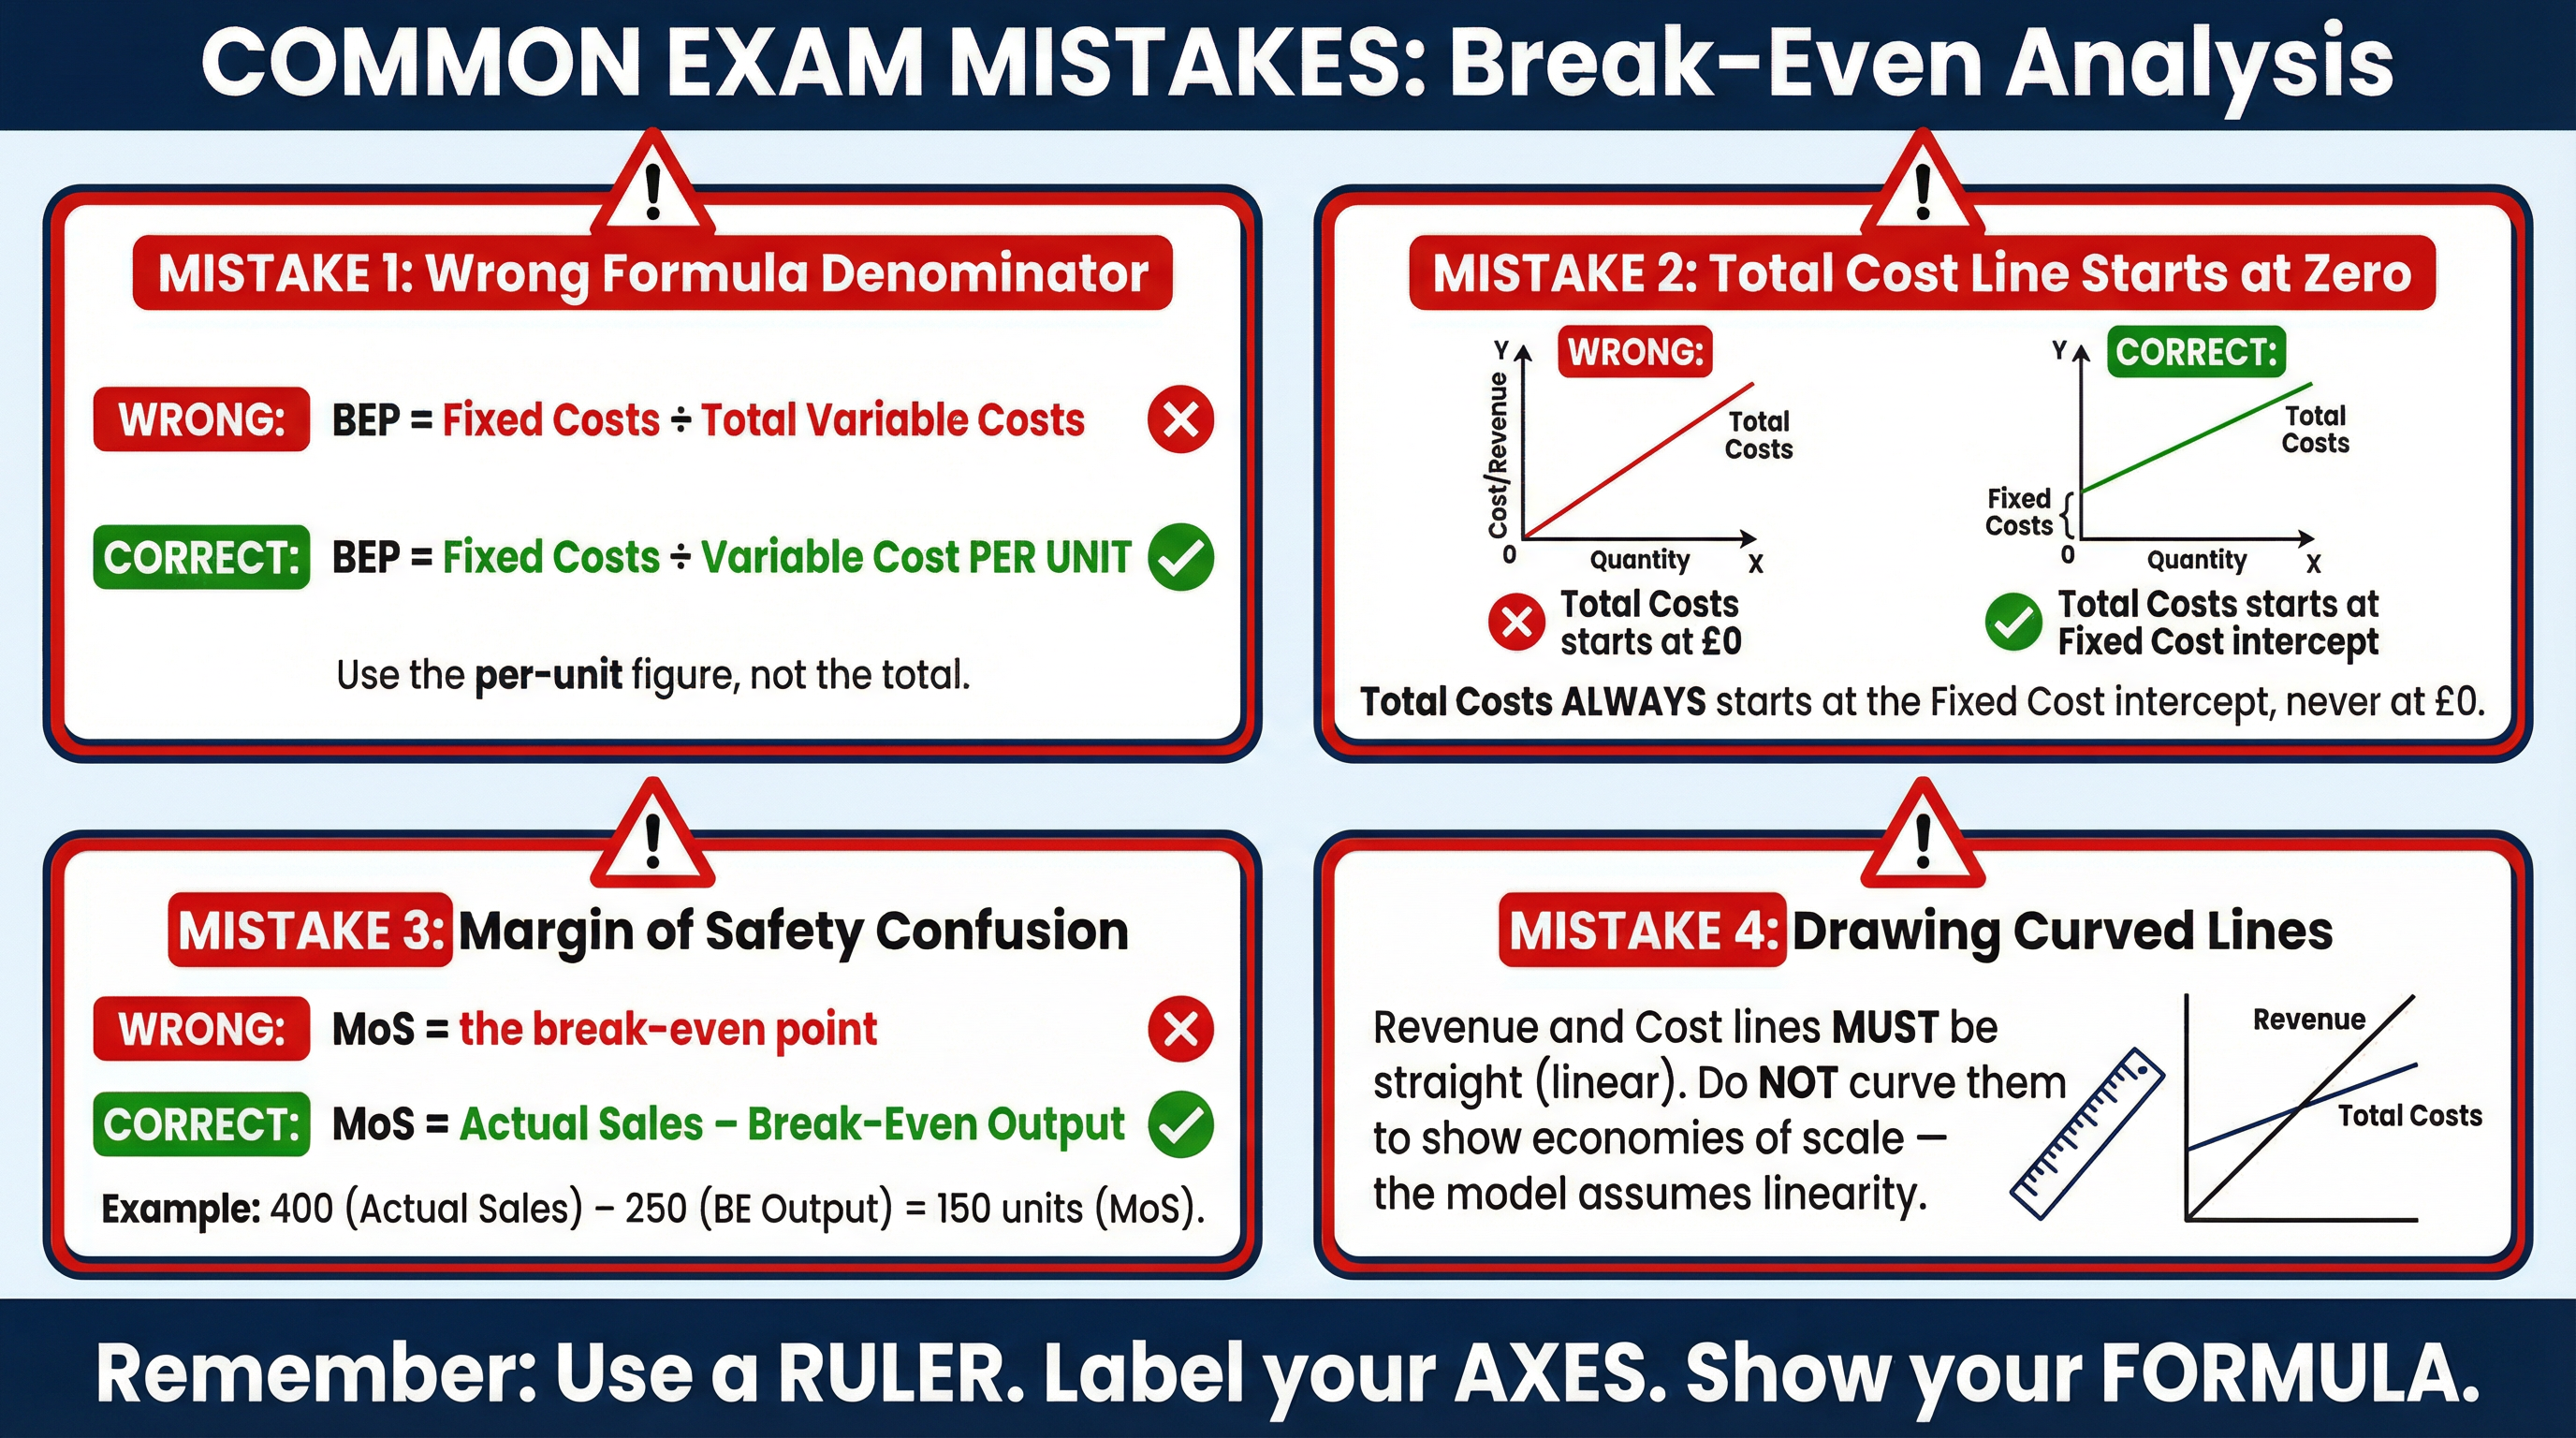
Total Costs (TC): This is the sum of fixed and variable costs. The formula is: Total Costs = Fixed Costs + Total Variable Costs. On a break-even chart, the Total Cost line starts at the Fixed Cost value on the y-axis and slopes upwards.
Revenue and Contribution
Total Revenue (TR): This is the total income from sales. The formula is: Total Revenue = Selling Price per Unit x Quantity Sold. On a break-even chart, the Total Revenue line starts from the origin (0,0) and slopes upwards.
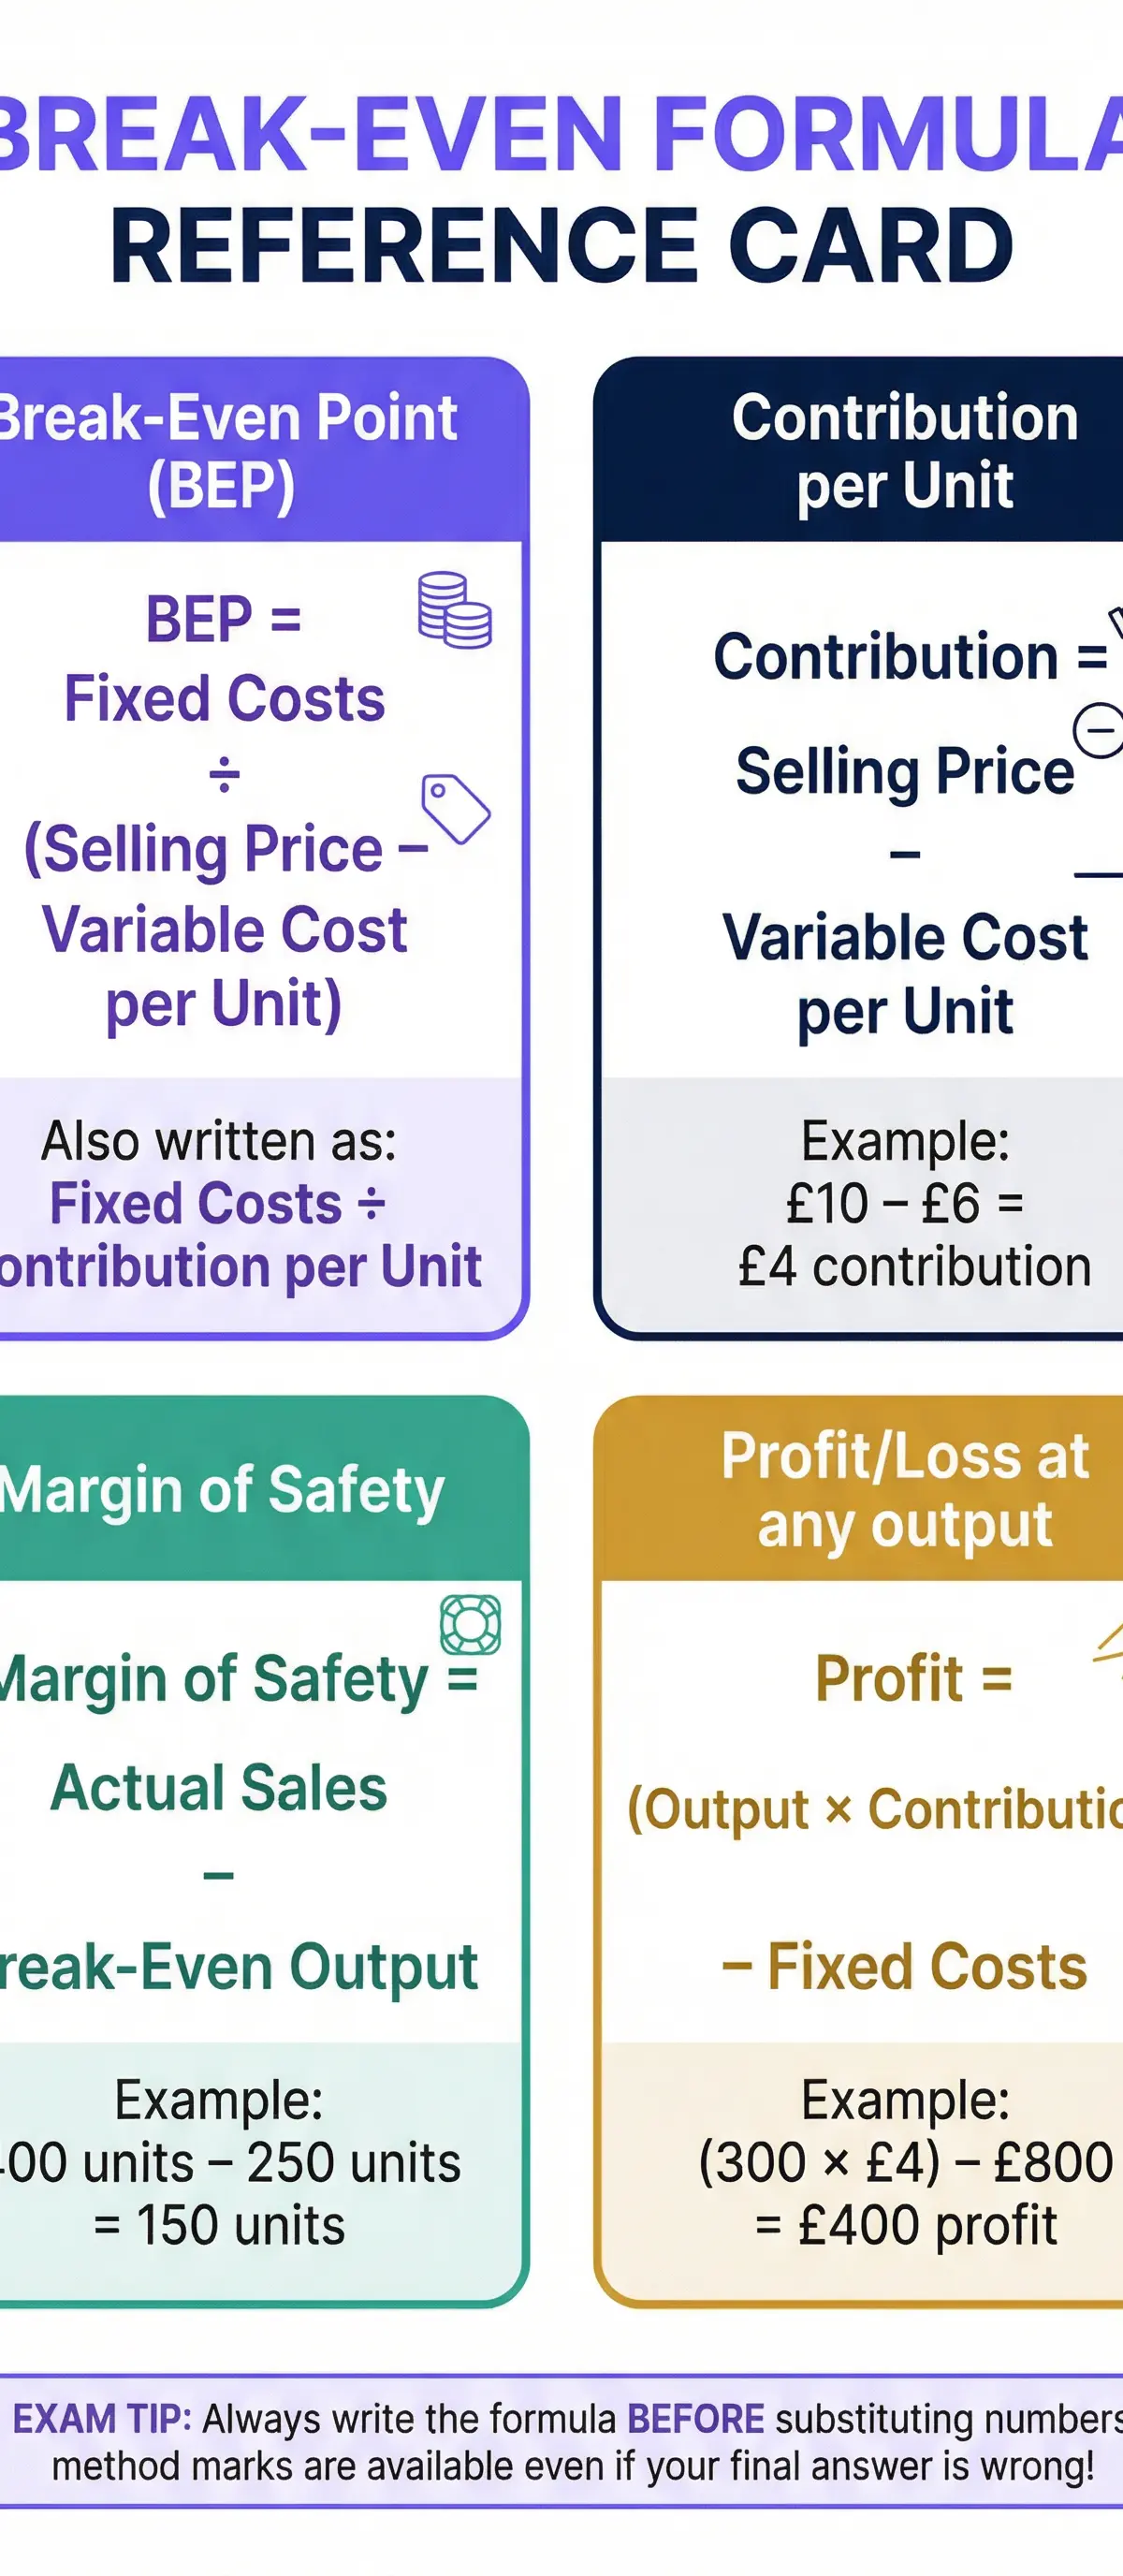
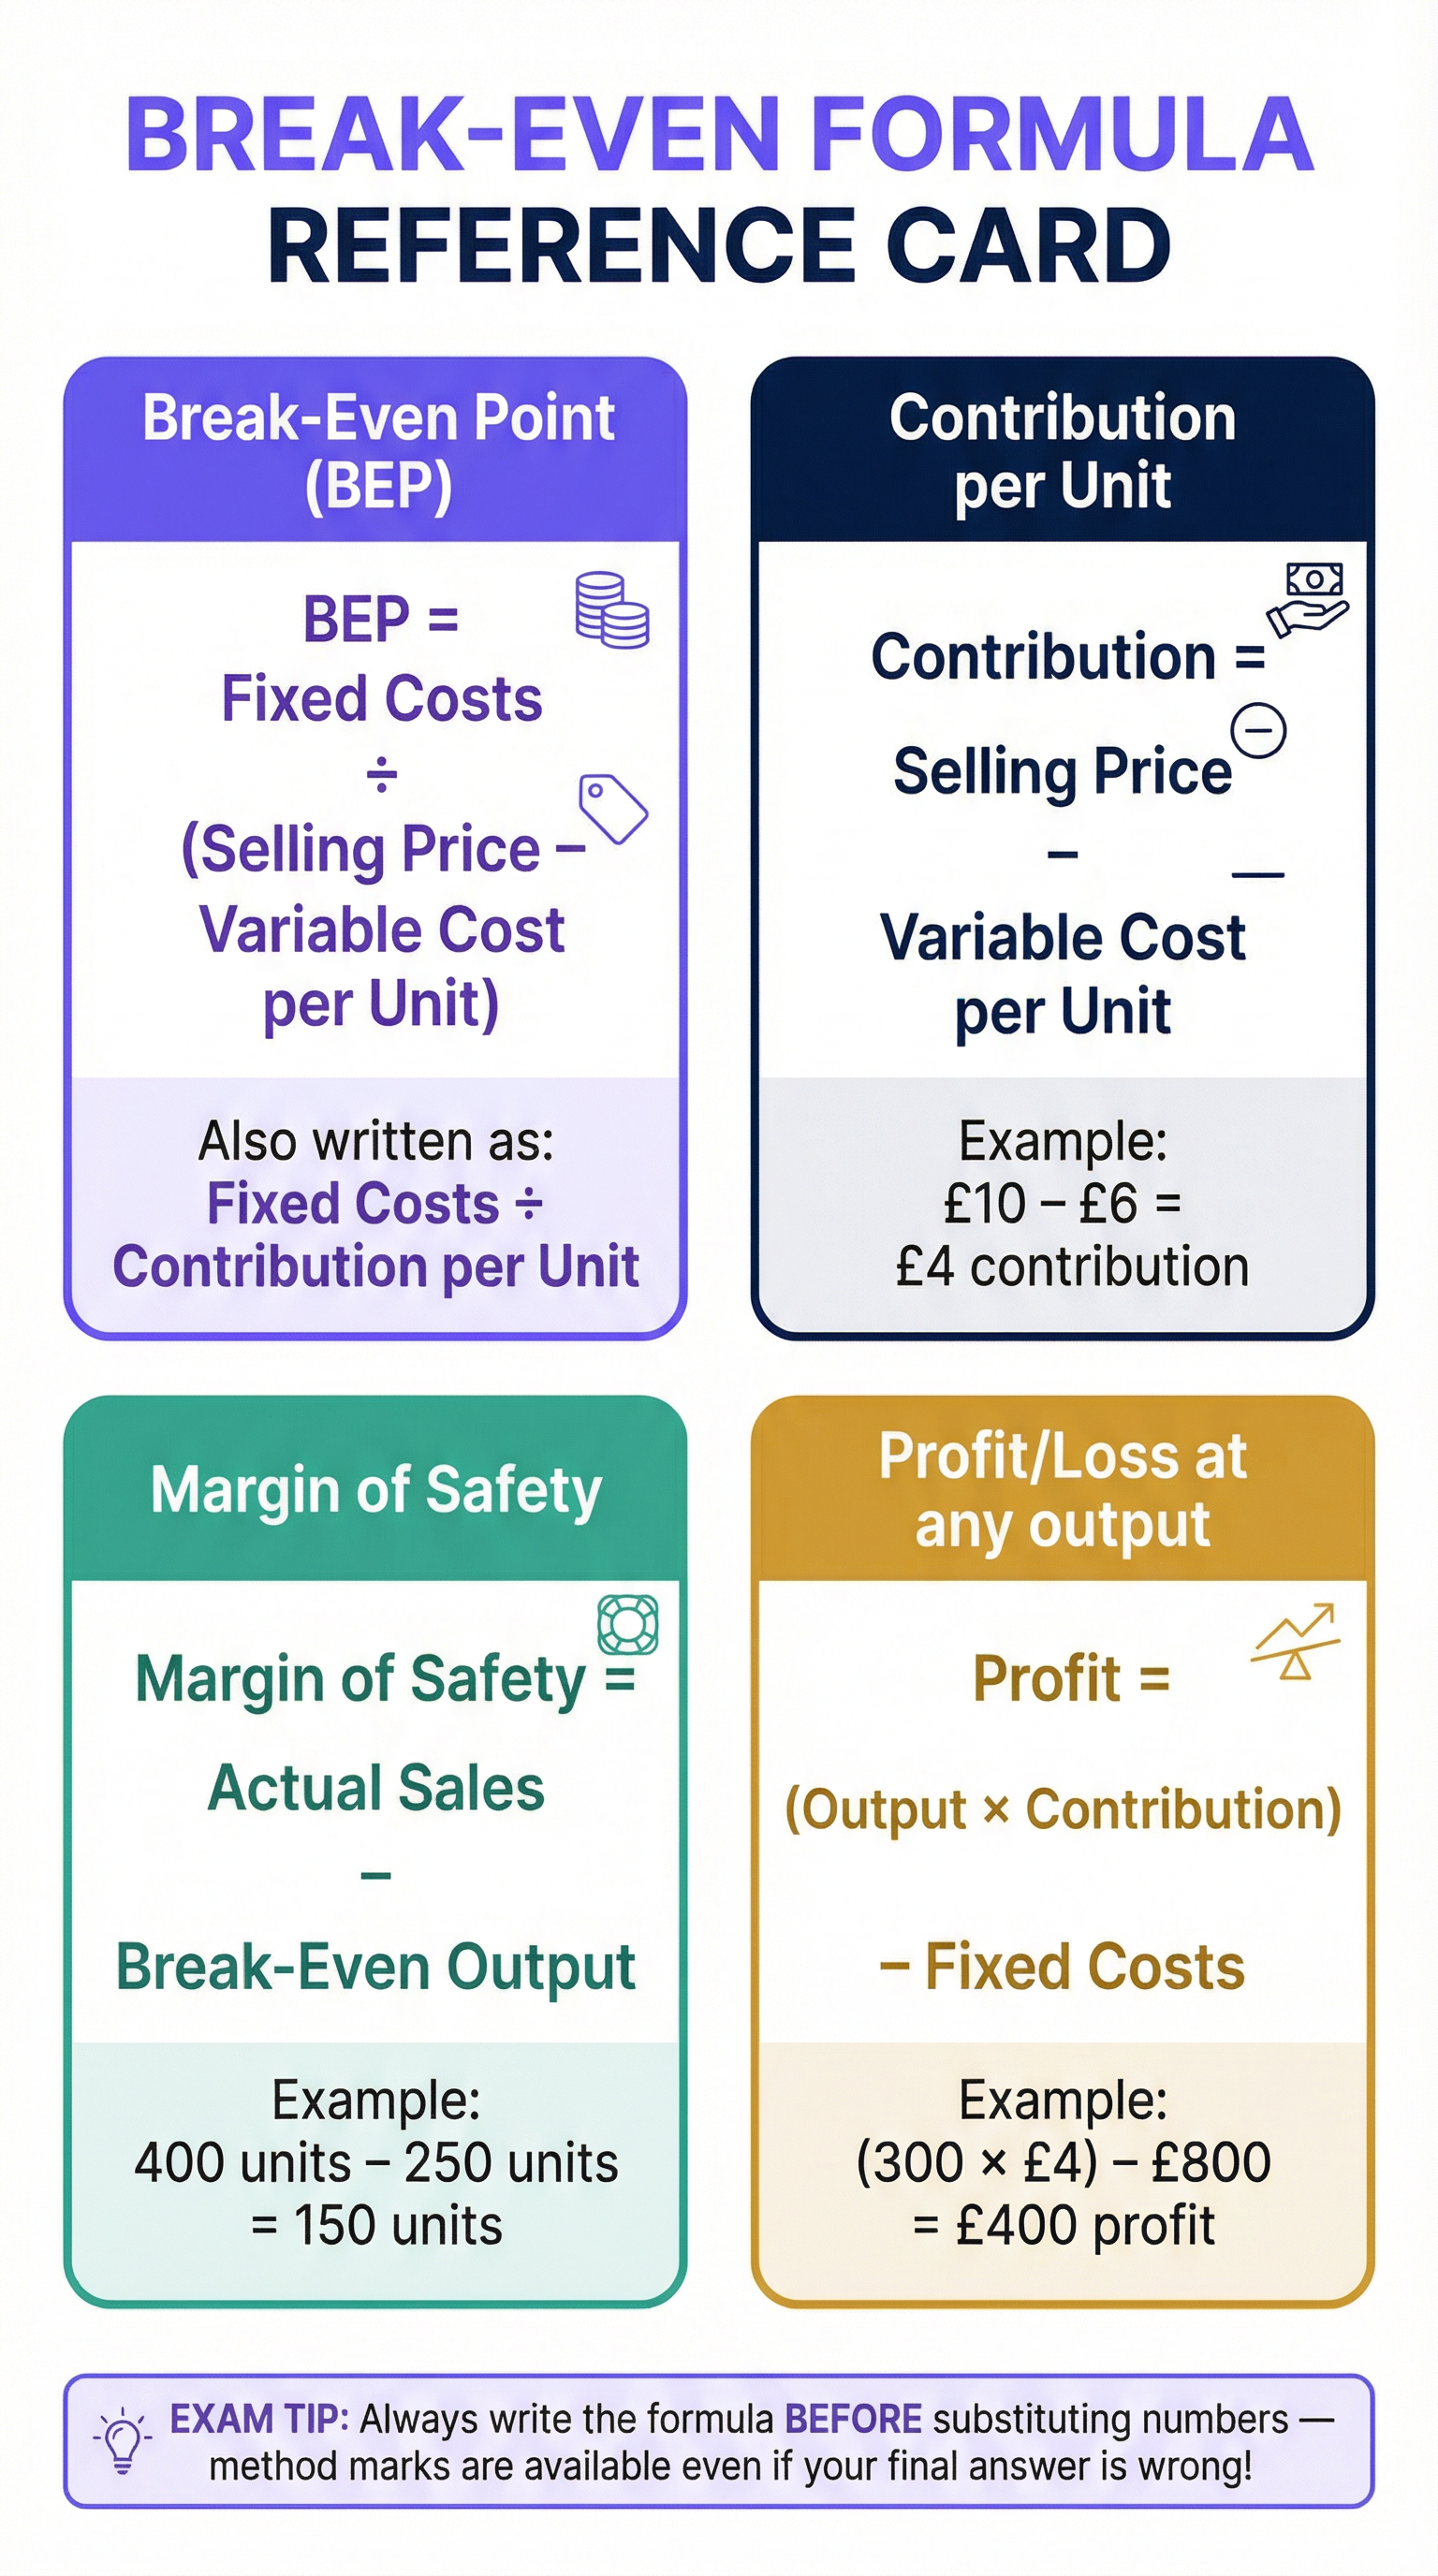
Contribution: This is the amount each unit sold contributes towards covering fixed costs and then generating a profit. The formula is: Contribution per Unit = Selling Price per Unit - Variable Cost per Unit.
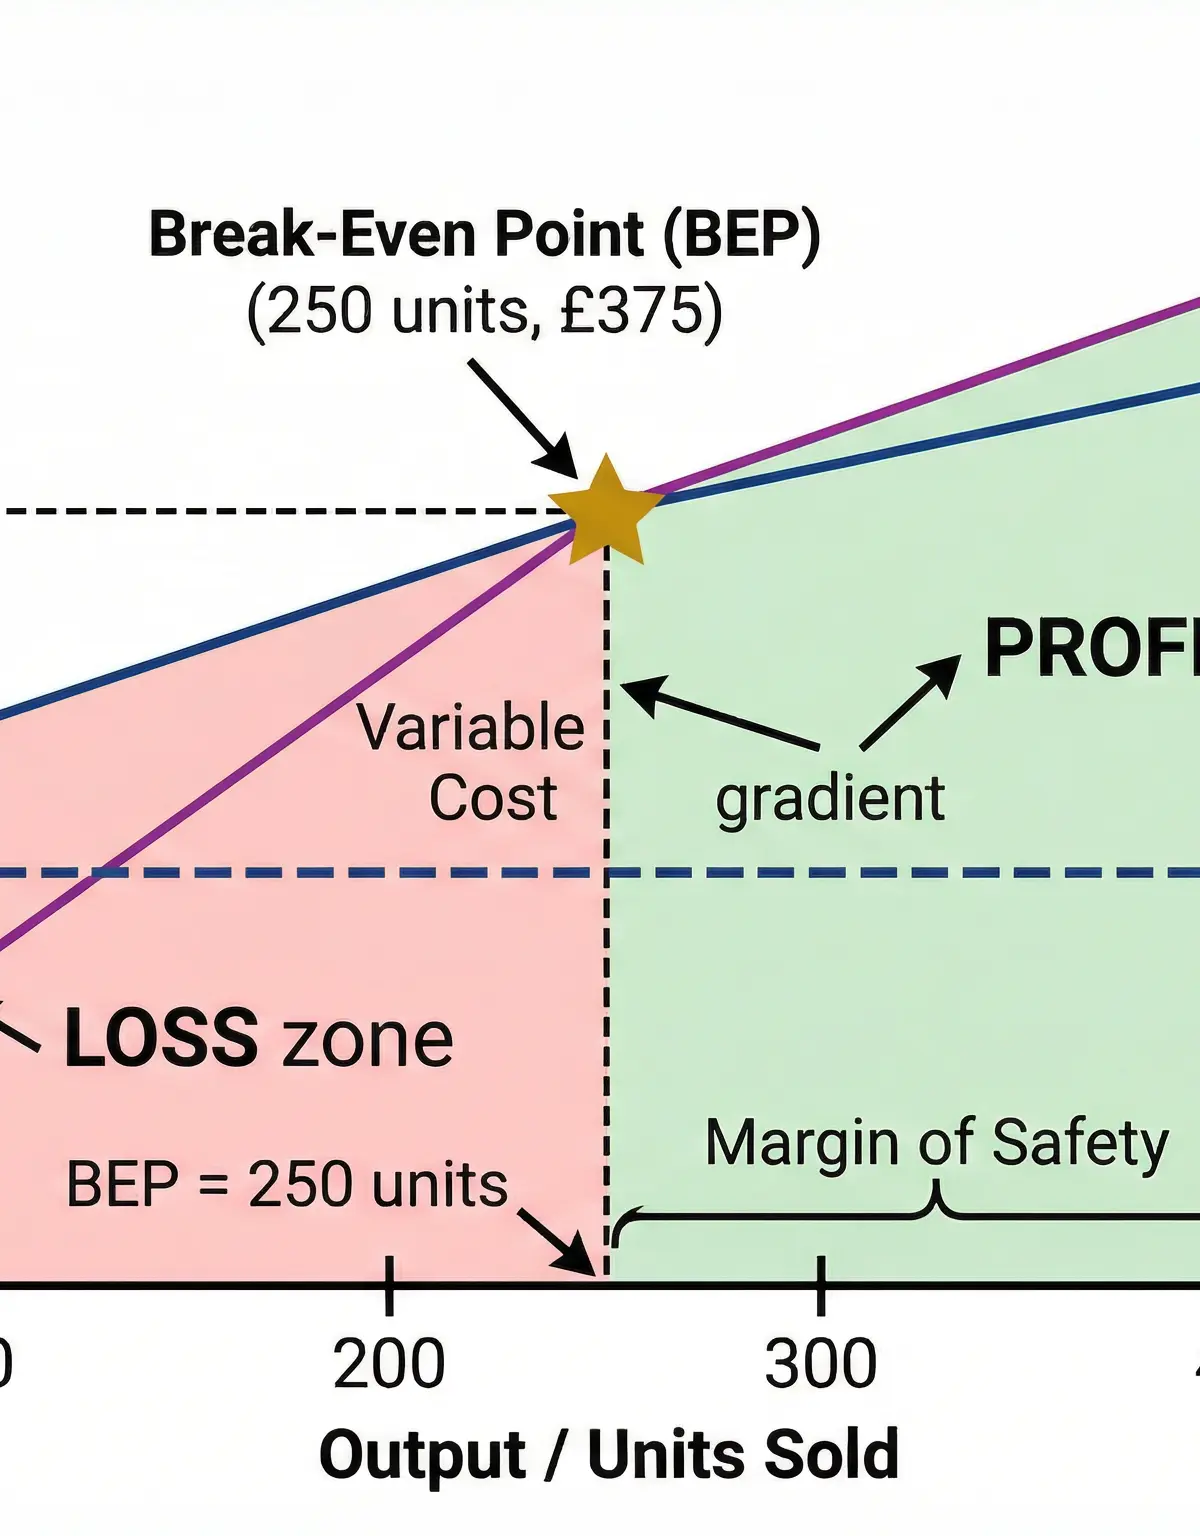
The Break-Even Point (BEP)
The Break-Even Point is the level of output at which Total Revenue equals Total Costs. At this point, the business is making neither a profit nor a loss. It can be calculated using the formula:
BEP (in units) = Fixed Costs / (Selling Price per Unit - Variable Cost per Unit)
Margin of Safety
The Margin of Safety is the difference between the actual level of sales and the break-even point. It shows how much sales can fall before the business starts making a loss. A larger margin of safety indicates lower risk.
Margin of Safety = Actual Sales - Break-Even Output
Limitations of Break-Even Analysis
While a useful tool, break-even analysis has several limitations that examiners expect you to discuss in evaluation questions:
- Assumes all output is sold: The model does not account for unsold stock.
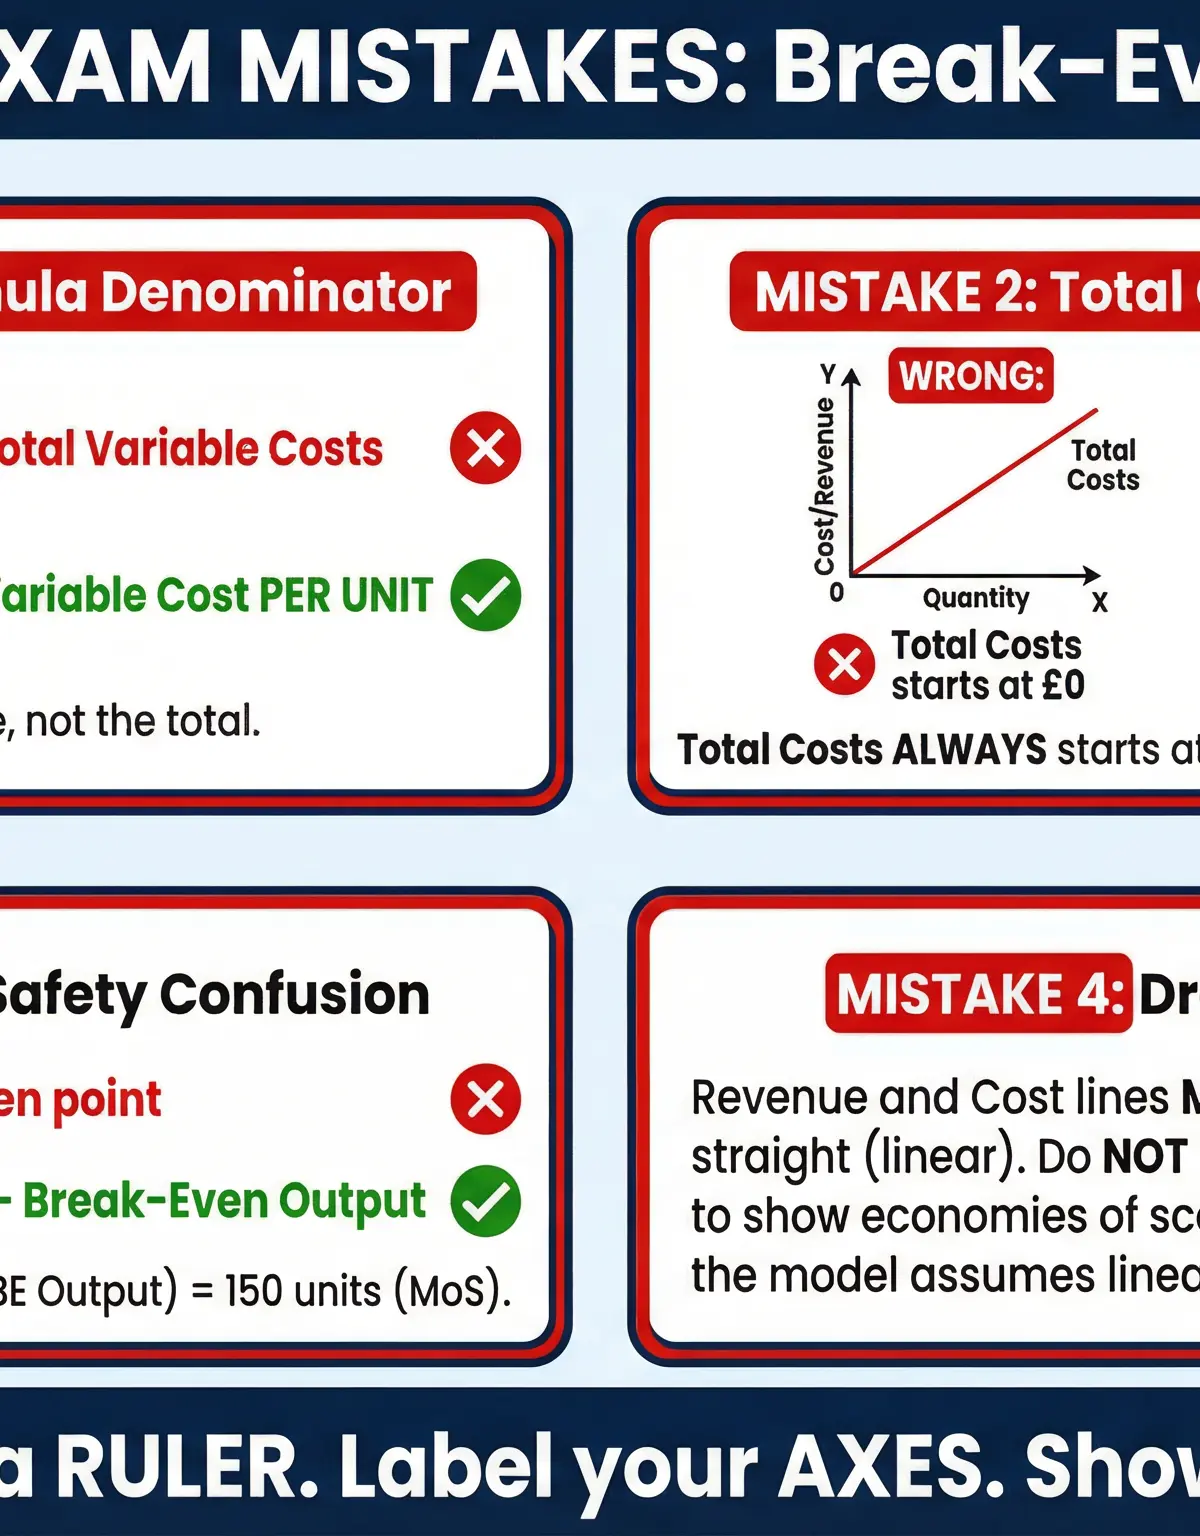
- Assumes costs and revenues are linear: It ignores economies of scale (which would curve the cost line) or price discounts for bulk orders (which would affect the revenue line).
- It is a static model: It provides a snapshot at one point in time and does not account for changes in the business environment.
- Accuracy of data: The analysis is only as good as the data used. Inaccurate cost and revenue figures will lead to a misleading break-even point.
Visual Resources
3 diagrams and illustrations
Interactive Diagrams
1 interactive diagram to visualise key concepts
Conceptual Flow Outline
A flowchart showing the steps to calculate the break-even point.
Worked Examples
3 worked examples — open one to explore the question and available guidance.
Practice Questions
Test your understanding — click to reveal model answers
A florist has fixed costs of £1,200 per month. Each bouquet sells for £25 and has variable costs of £10. How many bouquets must be sold each month to break even?
Hint: First, calculate the contribution per bouquet.
If the florist in the previous question actually sells 100 bouquets, what is their margin of safety?
Hint: Margin of safety is the difference between actual sales and break-even sales.
Evaluate the usefulness of break-even analysis to a large, multinational car manufacturer. (12 marks)
Hint: Consider the scale and complexity of a multinational car manufacturer. Think about the limitations of the model in this context.
Explain how a fall in variable costs would affect a firm's break-even point.
Hint: Think about the impact on the contribution per unit.
Draw a fully labelled break-even chart for a business with Fixed Costs of £300, a Selling Price of £3 per unit, and Variable Costs of £1 per unit. Assume the chart shows output up to 300 units.
Hint: Calculate the break-even point first. Then draw and label your axes, the fixed cost line, the total cost line, and the total revenue line. Mark the break-even point.