Pearson Edexcel · GCSE · Business
Course version: 1BS0 · Version from Sept 2017
The use and interpretation of quantitative business data to
Full specification wording
Understanding business performance: The use and interpretation of quantitative business data to
Quantitative business data involves numerical information that can be measured and analysed statistically.
Checked against the Pearson Edexcel 1BS0 specification (opens in a new tab) on .
- Point 1 of 3
- 3 key terms
Study notes
From the checked teaching notes for this specification point.
The idea
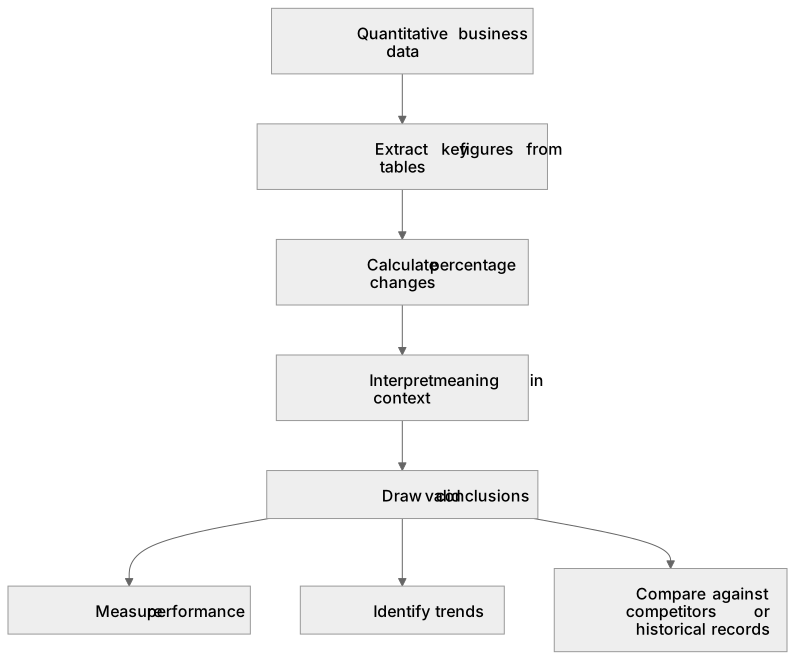
Quantitative business data involves numerical information that can be measured and analysed statistically. Businesses use this data to measure performance, identify trends, and compare results against competitors or historical records. Interpreting this data requires understanding what the numbers represent in a real-world context, such as recognising that a 10% increase in revenue might be offset by a 15% rise in costs.
For example: Interpreting a steady decline in footfall data helps a retailer understand why sales volume is dropping, prompting them to investigate external factors or shift focus to e-commerce.
What earns the marks
- Identify and extract relevant numerical data from a provided business context or table.
- Perform accurate calculations using quantitative data, such as percentage changes or averages.
- Interpret the meaning of numerical changes, explaining whether they represent a positive or negative outcome for the business.
- Use quantitative evidence to compare different time periods, products, or business options.
Common mistakes and how to put them right
Copying data without explaining its meaning.
Put it right: Interpret what the data shows about the business's performance or situation.
Confusing absolute numbers with percentages.
Put it right: Clearly distinguish between a numerical increase (e.g. £500) and a percentage increase (e.g. 5%).
Ignoring the context of the data.
Put it right: Relate the numerical findings back to the specific business scenario provided in the case study.
Exam tips
- Always quote specific figures from the data provided to support your analytical points.
- When interpreting data, look for trends over time rather than just focusing on a single isolated figure.
- Double-check all calculations, especially when working out percentage changes or profit margins.
Try the lesson
The start of the Understanding business performance: The use and interpretation of quantitative business data to lesson, made from checked teaching notes for this specification point.
Have a go first
Which of the following is an example of quantitative business data?
Listen
Quantitative business data involves numerical information that can be measured and analysed statistically. Businesses use this data to measure performance, identify trends, and compare results against competitors or historical records. Interpreting this data requires understanding what the numbers represent in a real-world context, such as recognising that a 10% increase in revenue might be offset by a 15% rise in costs. For example, interpreting a steady decline in footfall data helps a retailer understand why sales volume is dropping, prompting them to investigate external factors or shift focus to e-commerce. A strong answer earns marks for these points. Identify and extract relevant numerical data from a provided business context or table. Perform accurate calculations using quantitative data, such as percentage changes or averages. Interpret the meaning of numerical changes, explaining whether they represent a positive or negative outcome for the business. Use quantitative evidence to compare different time periods, products, or business options. A common slip: Copying data without explaining its meaning. Instead, interpret what the data shows about the business's performance or situation. Exam tip: Always quote specific figures from the data provided to support your analytical points.
See it
Key words
Say what each word means before you turn the card.
Quantitative analysis
Try answering aloud or in your head before turning the card.
Data interpretation
Try answering aloud or in your head before turning the card.
Numerical trends
Try answering aloud or in your head before turning the card.
See every definition
- Quantitative analysis
- The use and interpretation of numerical business information that can be measured and analysed statistically.
- Data interpretation
- Understanding what the numbers represent in a real-world context, such as whether a numerical change is a positive or negative outcome.
- Numerical trends
- Patterns over time in quantitative data, such as a steady decline in footfall data.
Label the diagram
Some boxes have lost their names. Pick the right name for each number.
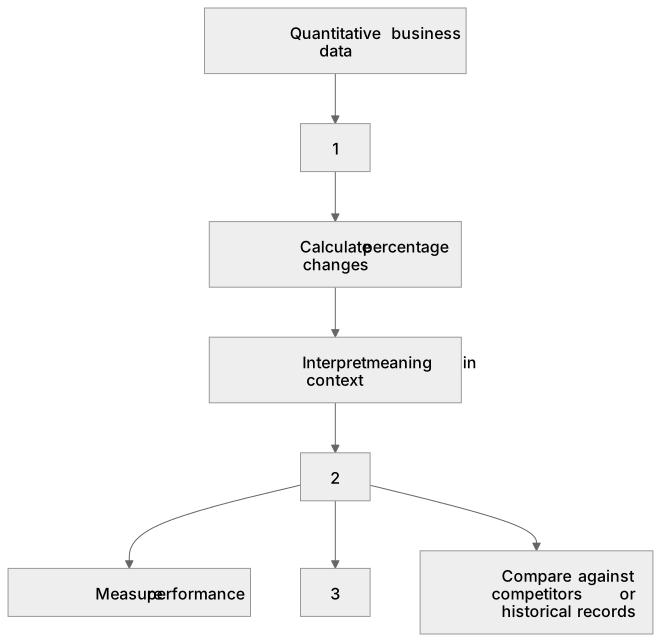
1Box 1
2Box 2
3Box 3
There is more to this lesson
The full lesson goes on to check your understanding and help you earn the marks. Create a free account to carry on, with your progress saved.
A week of Premium from your first lesson · Then the free plan continues · No card, no charge
Test your understanding of Understanding business performance: The use and interpretation of quantitative business data to
Active recall beats re-reading. Take an instant quiz now to test what you’ve learned and lock it into long-term memory.
A week of Premium from your first lesson · Then the free plan continues · No card, no charge