Pearson Edexcel · GCSE · Business
Course version: 1BS0 · Version from Sept 2017
Support, inform and justify business decisions: ● information from graphs…
Full specification wording
Understanding business performance: support, inform and justify business decisions: ● information from graphs and charts ● financial data ● marketing data ● market data.
Businesses rely on various data sources to support, inform, and justify strategic decisions.
Checked against the Pearson Edexcel 1BS0 specification (opens in a new tab) on .
- Point 2 of 3
Study notes
From the checked teaching notes for this specification point.
The idea
Businesses rely on various data sources to support, inform, and justify strategic decisions. Information from graphs and charts provides visual trends, such as a line graph showing seasonal sales fluctuations, helping managers time their inventory purchases. Financial data, including revenue, costs, and profit margins, justifies investment or cost-cutting decisions. Marketing data, such as conversion rates or customer acquisition costs, informs promotional strategies and budget allocation. Market data, including market share and demographic statistics, supports decisions about entering new segments or launching products. By synthesising these four data types, a business can make evidence-based choices rather than relying on intuition.
What earns the marks
- Extract and interpret trends from visual data formats like bar charts, pie charts, and line graphs.
- Use financial data (e.g. profit, cash flow) to justify decisions regarding expansion, pricing, or cost management.
- Apply marketing data to inform decisions about the marketing mix, such as adjusting promotional spending.
- Analyse market data (e.g. market size, competitor share) to support strategic choices like targeting a new demographic.
- Synthesise multiple data sources to build a comprehensive justification for a proposed business action.
Common mistakes and how to put them right
Stating a decision without linking it to the provided data.
Put it right: Use specific data points from the charts or financial tables to justify the chosen course of action.
Confusing marketing data with market data.
Put it right: Use marketing data for internal promotional performance and market data for external industry or competitor analysis.
Misreading the axes or keys on graphs and charts.
Put it right: Carefully check the labels, units (e.g. thousands of pounds), and timeframes before extracting information.
Exam tips
- When asked to justify a decision, explicitly state how the financial or market data makes your chosen option the most viable.
- Pay close attention to the units on graphs, such as whether revenue is shown in £s or £000s.
- Combine different types of data, such as using market growth data alongside financial costs, to build a stronger, multi-faceted argument.
Try the lesson
The start of the Understanding business performance: support, inform and justify business decisions: ● information from graphs and charts ● financial data ● marketing data ● market data. lesson, made from checked teaching notes for this specification point.
Have a go first
A business wants to decide whether to launch a new product by analysing the market share of its competitors. Which type of data is the business using to inform this decision?
Listen
Businesses rely on various data sources to support, inform, and justify strategic decisions. Information from graphs and charts provides visual trends, such as a line graph showing seasonal sales fluctuations, helping managers time their inventory purchases. Financial data, including revenue, costs, and profit margins, justifies investment or cost-cutting decisions. Marketing data, such as conversion rates or customer acquisition costs, informs promotional strategies and budget allocation. Market data, including market share and demographic statistics, supports decisions about entering new segments or launching products. By synthesising these four data types, a business can make evidence-based choices rather than relying on intuition. A strong answer earns marks for these points. Extract and interpret trends from visual data formats like bar charts, pie charts, and line graphs. Use financial data (e.g. profit, cash flow) to justify decisions regarding expansion, pricing, or cost management. Apply marketing data to inform decisions about the marketing mix, such as adjusting promotional spending. Analyse market data (e.g. market size, competitor share) to support strategic choices like targeting a new demographic. A common slip: Stating a decision without linking it to the provided data. Instead, use specific data points from the charts or financial tables to justify the chosen course of action. Exam tip: When asked to justify a decision, explicitly state how the financial or market data makes your chosen option the most viable.
See it
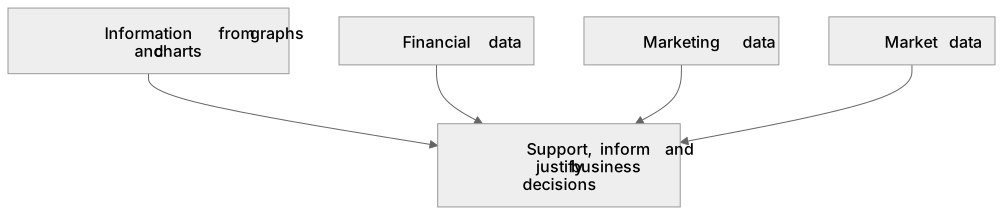
Label the diagram
Some boxes have lost their names. Pick the right name for each number.
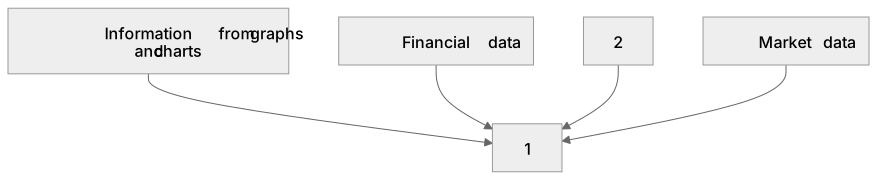
1Box 1
2Box 2
There is more to this lesson
The full lesson goes on to check your understanding and help you earn the marks. Create a free account to carry on, with your progress saved.
A week of Premium from your first lesson · Then the free plan continues · No card, no charge
Test your understanding of Understanding business performance: support, inform and justify business decisions: ● information from graphs and charts ● financial data ● marketing data ● market data.
Active recall beats re-reading. Take an instant quiz now to test what you’ve learned and lock it into long-term memory.
A week of Premium from your first lesson · Then the free plan continues · No card, no charge