AQA · A-Level · Chemistry
Course version: 7405 · Version from Sept 2016
Required practical 9 Investigate how pH changes when a weak acid reacts…
Full specification wording
pH curves, titrations and indicators (A-level only): Required practical 9 Investigate how pH changes when a weak acid reacts with a strong base and when a strong acid reacts with a weak base.
Required practical 9 produces the curves rather than assuming them.
Checked against the AQA 7405 specification (opens in a new tab) on .
- Point 5 of 5
- 4 key terms
Study notes
From the checked teaching notes for this specification point.
The idea
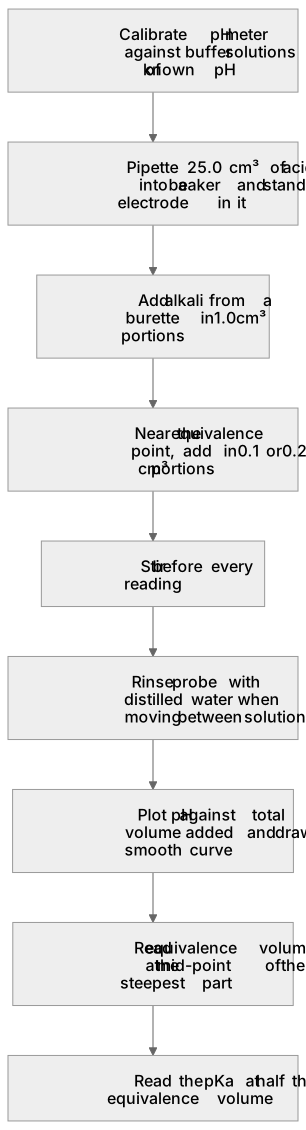
Required practical 9 produces the curves rather than assuming them. Calibrate the pH meter against buffer solutions of known pH first, because the absolute readings depend on it. Pipette 25.0 cm³ of the acid into a beaker, stand the electrode in it, and add the alkali from a burette. Add in 1.0 cm³ portions at first but in 0.1 or 0.2 cm³ portions near the equivalence point, where the pH changes fastest and where too coarse a step will simply miss the steep section. Stir before every reading and rinse the probe with distilled water when moving between solutions. Plot pH against total volume added and draw a smooth curve rather than joining the points with straight lines. Read the equivalence volume at the mid-point of the steepest part, and read the pKa at half that volume.
What earns the marks
- Calibrating the pH meter with buffer solutions of known pH before starting.
- Adding the alkali in smaller portions near the equivalence point, where the pH changes fastest.
- Stirring the mixture before each pH reading.
- Plotting pH against total volume added and drawing a smooth curve.
- Identifying the equivalence point at the mid-point of the steepest part of the curve.
Common mistakes and how to put them right
Adding the alkali in 5 cm³ portions throughout, so the steep region is missed entirely.
Joining the plotted points with straight line segments instead of a smooth curve.
Rinsing the pH probe with the acid rather than with distilled water between readings.
Leaving the meter uncalibrated and then treating the absolute pH values as accurate.
Reading the equivalence point at pH 7 rather than at the mid-point of the steep section.
Exam tips
- If asked to improve the method, 'add smaller volumes near the equivalence point' is almost always one of the marks.
- A pH meter is the answer whenever a titration has no steep section, because no indicator will work.
Try the lesson
The start of the pH curves, titrations and indicators (A-level only): Required practical 9 Investigate how pH changes when a weak acid reacts with a strong base and when a strong acid reacts with a weak base. lesson, made from checked teaching notes for this specification point.
Have a go first
In Required practical 9, which method is most appropriate to continuously monitor the pH of the reaction mixture as the base is added to generate a pH curve?
Listen
Required practical 9 produces the curves rather than assuming them. Calibrate the pH meter against buffer solutions of known pH first, because the absolute readings depend on it. Pipette 25.0 cm³ of the acid into a beaker, stand the electrode in it, and add the alkali from a burette. Add in 1.0 cm³ portions at first but in 0.1 or 0.2 cm³ portions near the equivalence point, where the pH changes fastest and where too coarse a step will simply miss the steep section. Stir before every reading and rinse the probe with distilled water when moving between solutions. Plot pH against total volume added and draw a smooth curve rather than joining the points with straight lines. Read the equivalence volume at the mid-point of the steepest part, and read the pKa at half that volume. A strong answer earns marks for these points. calibrating the pH meter with buffer solutions of known pH before starting. adding the alkali in smaller portions near the equivalence point, where the pH changes fastest. stirring the mixture before each pH reading. plotting pH against total volume added and drawing a smooth curve. Exam tip: If asked to improve the method, 'add smaller volumes near the equivalence point' is almost always one of the marks.
See it
Key words
Say what each word means before you turn the card.
Required practical 9
Try answering aloud or in your head before turning the card.
pH meter calibration
Try answering aloud or in your head before turning the card.
volume increments
Try answering aloud or in your head before turning the card.
plotting a smooth curve
Try answering aloud or in your head before turning the card.
See every definition
- Required practical 9
- An investigation of how pH changes when a weak acid reacts with a strong base and when a strong acid reacts with a weak base.
- pH meter calibration
- Carried out against buffer solutions of known pH before starting, because the absolute readings depend on it.
- volume increments
- Added in 1.0 cm³ portions at first but in 0.1 or 0.2 cm³ portions near the equivalence point, where the pH changes fastest.
- plotting a smooth curve
- Plotting pH against total volume added and drawing a smooth curve rather than joining the points with straight lines.
Label the diagram
Some boxes have lost their names. Pick the right name for each number.
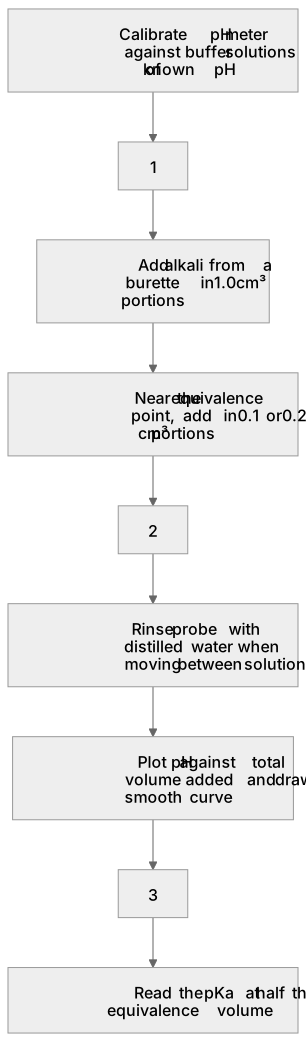
1Box 1
2Box 2
3Box 3
There is more to this lesson
The full lesson goes on to check your understanding and help you earn the marks. Create a free account to carry on, with your progress saved.
A week of Premium from your first lesson · Then the free plan continues · No card, no charge
Test your understanding of pH curves, titrations and indicators (A-level only): Required practical 9 Investigate how pH changes when a weak acid reacts with a strong base and when a strong acid reacts with a weak base.
Active recall beats re-reading. Take an instant quiz now to test what you’ve learned and lock it into long-term memory.
A week of Premium from your first lesson · Then the free plan continues · No card, no charge