AQA · GCSE · Combined Science
Course version: 8464 · Version from Sept 2018
Students should be able to extract and interpret information from charts,…
Full specification wording
Abiotic factors: Students should be able to extract and interpret information from charts, graphs and tables relating to the effect of abiotic factors on organisms within a community.
This skill requires students to read data displays about abiotic factors such as light intensity, temperature, moisture, pH and dissolved oxygen, then relate the patterns to organisms in a community.
Checked against the AQA 8464 specification (opens in a new tab) on .
- Point 10 of 10
Study notes
From the checked teaching notes for this specification point.
The idea
This skill requires students to read data displays about abiotic factors such as light intensity, temperature, moisture, pH and dissolved oxygen, then relate the patterns to organisms in a community. Extraction means locating a value or trend from a chart, graph or table. Interpretation means explaining what the pattern shows about survival, growth, abundance or distribution.
For example: A graph may show that plant species richness rises with light intensity up to a plateau, or that a fish population falls as water temperature rises.
What earns the marks
- Identify the variables shown on each axis or column heading, including units, before reading any values.
- Describe the overall trend, such as increase, decrease, plateau or no clear relationship, rather than listing isolated points.
- Support the description with figures read accurately from the display, including appropriate units.
- Link the abiotic factor to a biological effect on organisms, for example growth, survival, reproduction, abundance or distribution.
- Recognise that different species have different tolerance ranges, so a change may favour some organisms and harm others.
- Use comparative language when describing relationships, such as higher, lower, steeper or more rapid.
- Distinguish correlation from a stated cause and avoid claiming proof from a single data set.
Common mistakes and how to put them right
Reading the wrong scale or ignoring a break in an axis.
Put it right by checking each axis carefully and using the stated intervals.
Describing every point instead of the trend.
Put it right by summarising the pattern first and then quoting one or two representative values.
Treating a correlation as proof that the abiotic factor caused the change.
Put it right by saying the data suggest a relationship and that other factors may also be involved.
Exam tips
- Use the data in the question rather than general knowledge alone, and quote numbers with units to support each point.
- Structure longer answers as trend, evidence, explanation so the link between the abiotic factor and the community is clear.
- Check whether the question asks for extraction, interpretation or both, and make sure the answer does the required job.
Try the lesson
The start of the Abiotic factors: Students should be able to extract and interpret information from charts, graphs and tables relating to the effect of abiotic factors on organisms within a community. lesson, made from checked teaching notes for this specification point.
Have a go first
A table shows the number of mayfly larvae found in a stream at four different oxygen concentrations. At 4 mg/dm³ there were 30 larvae, at 6 mg/dm³ there were 55 larvae, at 8 mg/dm³ there were 80 larvae and at 10 mg/dm³ there were 95 larvae. What happens to the number of mayfly larvae as the oxygen concentration increases?
Listen
This skill requires students to read data displays about abiotic factors such as light intensity, temperature, moisture, pH and dissolved oxygen, then relate the patterns to organisms in a community. Extraction means locating a value or trend from a chart, graph or table. Interpretation means explaining what the pattern shows about survival, growth, abundance or distribution. For example, a graph may show that plant species richness rises with light intensity up to a plateau, or that a fish population falls as water temperature rises. A strong answer earns marks for these points. Identify the variables shown on each axis or column heading, including units, before reading any values. Describe the overall trend, such as increase, decrease, plateau or no clear relationship, rather than listing isolated points. Support the description with figures read accurately from the display, including appropriate units. Link the abiotic factor to a biological effect on organisms, for example growth, survival, reproduction, abundance or distribution. A common slip: Reading the wrong scale or ignoring a break in an axis. Instead, checking each axis carefully and using the stated intervals. Exam tip: Use the data in the question rather than general knowledge alone, and quote numbers with units to support each point.
See it
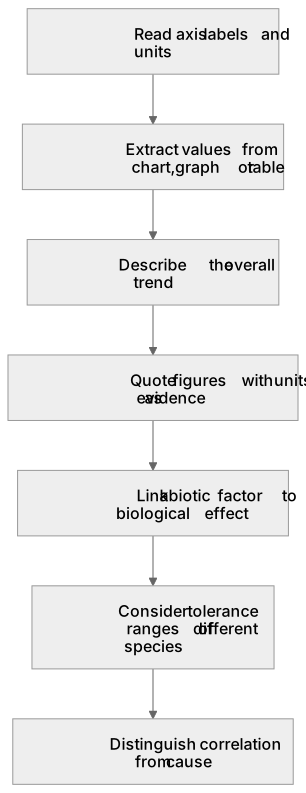
Put it in order
Put these steps in the order they happen.
- 1. Distinguish correlation from cause
- 2. Consider tolerance ranges of different species
- 3. Describe the overall trend
- 4. Link abiotic factor to biological effect
- 5. Read axis labels and units
- 6. Extract values from chart, graph or table
- 7. Quote figures with units as evidence
Label the diagram
Some boxes have lost their names. Pick the right name for each number.
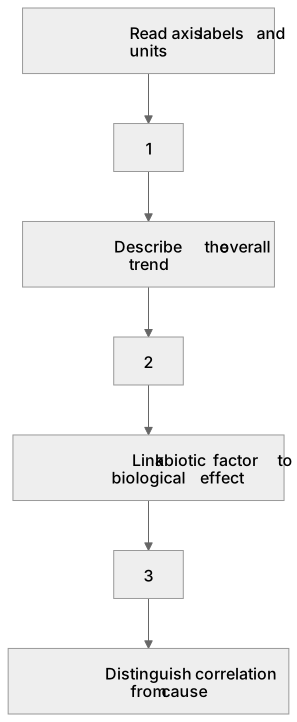
1Box 1
2Box 2
3Box 3
There is more to this lesson
The full lesson goes on to check your understanding and help you earn the marks. Create a free account to carry on, with your progress saved.
A week of Premium from your first lesson · Then the free plan continues · No card, no charge
Test your understanding of Abiotic factors: Students should be able to extract and interpret information from charts, graphs and tables relating to the effect of abiotic factors on organisms within a community.
Active recall beats re-reading. Take an instant quiz now to test what you’ve learned and lock it into long-term memory.
A week of Premium from your first lesson · Then the free plan continues · No card, no charge