AQA · GCSE · Combined Science
Course version: 8464 · Version from Sept 2018
(HT only) Students should be able to extract and interpret data from…
Full specification wording
Hormones in human reproduction: (HT only) Students should be able to extract and interpret data from graphs showing hormone levels during the menstrual cycle.
Extracting and interpreting data from interacting hormone graphs is strictly a Higher Tier (HT only) requirement.
Checked against the AQA 8464 specification (opens in a new tab) on .
- Point 10 of 10
- 4 key terms
Study notes
From the checked teaching notes for this specification point.
The idea
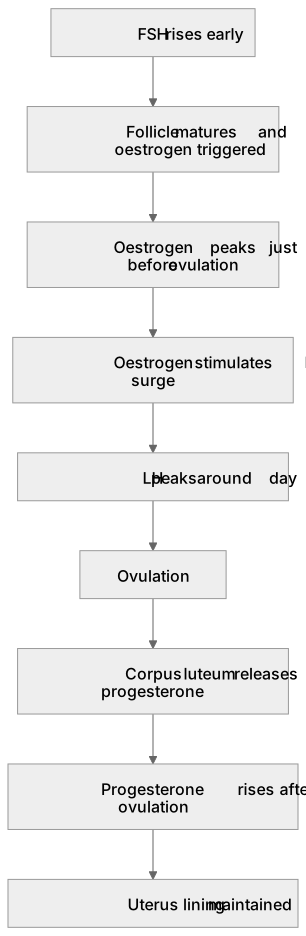
Extracting and interpreting data from interacting hormone graphs is strictly a Higher Tier (HT only) requirement. On a typical cycle graph, the x-axis shows days (0 to 28) and the y-axis shows relative hormone concentration. Four hormones interact: FSH, LH, oestrogen, and progesterone. FSH rises early, maturing a follicle and triggering oestrogen. Oestrogen peaks just before ovulation, stimulating an LH surge. LH peaks around day 14, causing ovulation. Progesterone, released by the corpus luteum, rises after ovulation to maintain the uterus lining. To extract data, read values directly off the axes; to interpret, link each peak to its specific reproductive role, such as identifying imminent ovulation from an LH surge.
What earns the marks
- Identify the axes: days of the cycle on the x-axis and relative hormone concentration on the y-axis, naming the specific hormones shown.
- Read specific values from the graph, such as the exact day of the LH peak or the relative concentration of oestrogen at its maximum.
- Describe the shape of each curve: FSH rises early, oestrogen peaks before ovulation, LH surges around day 14, and progesterone rises after ovulation.
- Link each hormone pattern to its function, for example stating that the LH surge causes ovulation and progesterone maintains the uterus lining.
- Compare curves to identify cause and effect, such as rising oestrogen preceding and triggering the LH surge.
- Use data to support a conclusion, quoting figures such as 'LH peaks at day 14' rather than describing the graph generally.
Common mistakes and how to put them right
Confusing which hormone peaks at ovulation.
Put it right by linking the LH surge directly to the release of the egg.
Reading the y-axis as absolute units when it is often relative concentration.
Put it right by quoting the scale exactly as shown and avoiding invented units.
Describing the graph without interpreting it.
Put it right by adding what each peak or trough means for the cycle, such as follicle maturation or lining maintenance.
Assuming progesterone peaks before ovulation.
Put it right by noting it rises after ovulation because it is secreted by the corpus luteum.
Exam tips
- Quote specific days and values from the graph to support each point, for example 'LH is highest at day 14'.
- Check the command word: 'extract' requires specific values read from the graph, while 'interpret' requires linking those values to hormone function.
Try the lesson
The start of the Hormones in human reproduction: (HT only) Students should be able to extract and interpret data from graphs showing hormone levels during the menstrual cycle. lesson, made from checked teaching notes for this specification point.
Have a go first
A student extracts data from a line graph showing hormone levels during a 28-day menstrual cycle. The graph shows the hormone level remaining low at 2 arbitrary units until day 12, peaking sharply at 25 arbitrary units on day 14, and returning to a low level by day 16. Which hormone is shown?
Listen
Extracting and interpreting data from interacting hormone graphs is strictly a Higher Tier (HT only) requirement. On a typical cycle graph, the x-axis shows days (0 to 28) and the y-axis shows relative hormone concentration. Four hormones interact: FSH, LH, oestrogen, and progesterone. FSH rises early, maturing a follicle and triggering oestrogen. Oestrogen peaks just before ovulation, stimulating an LH surge. LH peaks around day 14, causing ovulation. Progesterone, released by the corpus luteum, rises after ovulation to maintain the uterus lining. To extract data, read values directly off the axes; to interpret, link each peak to its specific reproductive role, such as identifying imminent ovulation from an LH surge. A strong answer earns marks for these points. Identify the axes: days of the cycle on the x-axis and relative hormone concentration on the y-axis, naming the specific hormones shown. Read specific values from the graph, such as the exact day of the LH peak or the relative concentration of oestrogen at its maximum. Describe the shape of each curve: FSH rises early, oestrogen peaks before ovulation, LH surges around day 14, and progesterone rises after ovulation. Link each hormone pattern to its function, for example stating that the LH surge causes ovulation and progesterone maintains the uterus lining. A common slip: Confusing which hormone peaks at ovulation: LH peaks around day 14, not FSH. Instead, linking the LH surge directly to the release of the egg. Exam tip: Quote specific days and values from the graph to support each point, for example 'LH is highest at day 14'.
See it
Key words
Say what each word means before you turn the card.
Ovulation
Try answering aloud or in your head before turning the card.
Corpus luteum
Try answering aloud or in your head before turning the card.
Extract data
Try answering aloud or in your head before turning the card.
Interpret data
Try answering aloud or in your head before turning the card.
See every definition
- Ovulation
- The event caused by the LH peak around day 14, when the egg is released.
- Corpus luteum
- The structure that releases progesterone, which rises after ovulation to maintain the uterus lining.
- Extract data
- Reading values directly off the axes, such as the exact day of the LH peak.
- Interpret data
- Linking each peak to its specific reproductive role, such as identifying imminent ovulation from an LH surge.
Label the diagram
Some boxes have lost their names. Pick the right name for each number.
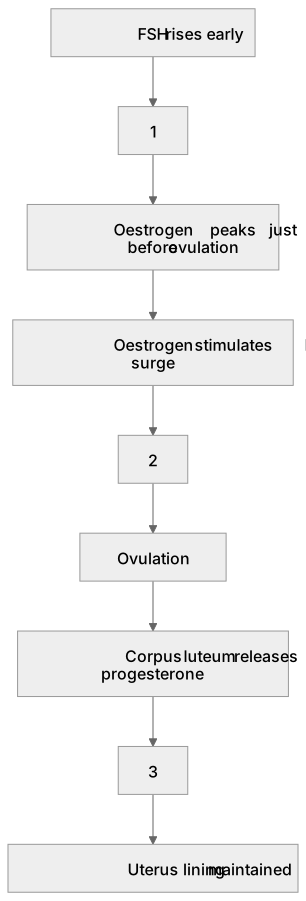
1Box 1
2Box 2
3Box 3
There is more to this lesson
The full lesson goes on to check your understanding and help you earn the marks. Create a free account to carry on, with your progress saved.
A week of Premium from your first lesson · Then the free plan continues · No card, no charge
Test your understanding of Hormones in human reproduction: (HT only) Students should be able to extract and interpret data from graphs showing hormone levels during the menstrual cycle.
Active recall beats re-reading. Take an instant quiz now to test what you’ve learned and lock it into long-term memory.
A week of Premium from your first lesson · Then the free plan continues · No card, no charge