AQA · GCSE · Combined Science
Course version: 8464 · Version from Sept 2018
Students should be able to determine speed from a distance–time graph.
Full specification wording
The distance–time relationship: Students should be able to determine speed from a distance–time graph.
Speed is found from a distance–time graph by calculating the gradient.
Checked against the AQA 8464 specification (opens in a new tab) on .
- Point 5 of 5
- 4 key terms
Study notes
From the checked teaching notes for this specification point.
The idea
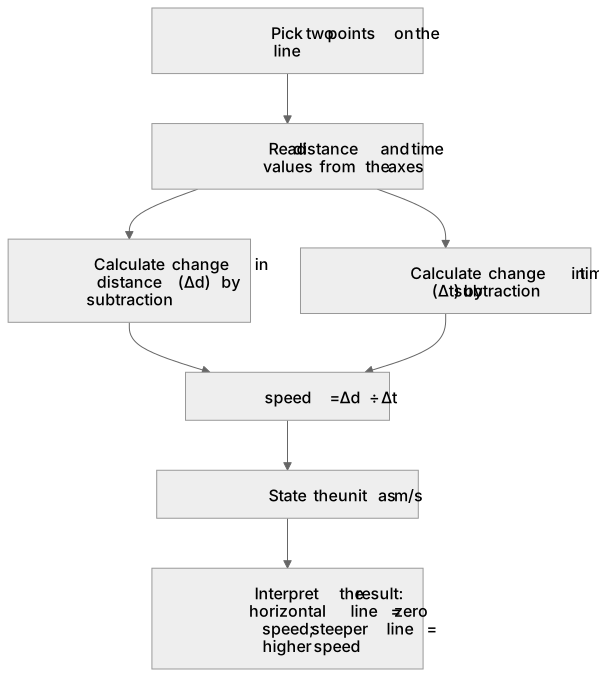
Speed is found from a distance–time graph by calculating the gradient. For a straight line, pick two points, read the change in distance (Δd) and time (Δt), then divide: speed = Δd ÷ Δt. For example, if distance changes from 20 m to 80 m while time changes from 4 s to 16 s, Δd = 60 m and Δt = 12 s, so speed = 60 m ÷ 12 s = 5 m/s. If the line is curved, speed is changing; find average speed using total distance and total time. Always include units (m/s) and show working. A horizontal line gives zero speed. A steeper line means a higher speed. This skill requires reading values from axes, performing the division, and interpreting the result.
What earns the marks
- Select two points on the line and read the corresponding distance and time values accurately from the axes.
- Calculate change in distance (Δd) and change in time (Δt) by subtraction, ensuring correct units.
- Divide Δd by Δt to obtain speed, and state the unit as m/s (or appropriate unit).
- For curved graphs, use total distance and total time for average speed, or (Higher Tier only) use a tangent at a point to estimate instantaneous speed.
- Interpret zero gradient as zero speed and a steeper gradient as a higher speed.
- Show working clearly, including the equation speed = distance ÷ time and substitution of values.
Common mistakes and how to put them right
Using the coordinates of a single point instead of the change between two points.
Put it right by subtracting to find Δd and Δt.
Forgetting to convert units, for example using minutes on the time axis but seconds in the speed unit.
Put it right by converting all values to consistent units before dividing.
Assuming the gradient of a curved line is constant.
Put it right by recognising that speed changes and using average speed or (Higher Tier only) a tangent.
Exam tips
- Choose two points on the line that are far apart and lie exactly on grid lines to make reading values easier and more accurate.
- Write down the equation speed = distance ÷ time before substituting numbers, so your method is clear.
- Check that your answer has the correct unit and a sensible size; for example, a car speed of 500 m/s is unrealistic, so re-check your calculation.
Try the lesson
The start of the The distance–time relationship: Students should be able to determine speed from a distance–time graph. lesson, made from checked teaching notes for this specification point.
Have a go first
A distance–time graph shows a straight line rising from 0 m at 0 s to 20 m at 10 s. What is the speed shown by this line?
Listen
Speed is found from a distance–time graph by calculating the gradient. For a straight line, pick two points, read the change in distance (Δd) and time (Δt), then divide: speed = Δd ÷ Δt. For example, if distance changes from 20 m to 80 m while time changes from 4 s to 16 s, Δd = 60 m and Δt = 12 s, so speed = 60 m ÷ 12 s = 5 m/s. If the line is curved, speed is changing; find average speed using total distance and total time. Always include units (m/s) and show working. A horizontal line gives zero speed. A steeper line means a higher speed. This skill requires reading values from axes, performing the division, and interpreting the result. A strong answer earns marks for these points. Select two points on the line and read the corresponding distance and time values accurately from the axes. Calculate change in distance (Δd) and change in time (Δt) by subtraction, ensuring correct units. Divide Δd by Δt to obtain speed, and state the unit as m/s (or appropriate unit). For curved graphs, use total distance and total time for average speed, or (Higher Tier only) use a tangent at a point to estimate instantaneous speed. A common slip: Using the coordinates of a single point instead of the change between two points. Instead, subtracting to find Δd and Δt. Exam tip: Choose two points on the line that are far apart and lie exactly on grid lines to make reading values easier and more accurate.
See it
Key words
Say what each word means before you turn the card.
Gradient as speed
Try answering aloud or in your head before turning the card.
Calculating change in distance and time
Try answering aloud or in your head before turning the card.
Average and instantaneous speed from graphs
Try answering aloud or in your head before turning the card.
Units and dimensional consistency
Try answering aloud or in your head before turning the card.
See every definition
- Gradient as speed
- Speed is found from a distance–time graph by calculating the gradient.
- Calculating change in distance and time
- Pick two points, read the change in distance (Δd) and time (Δt), then divide: speed = Δd ÷ Δt.
- Average and instantaneous speed from graphs
- For a curved line, find average speed using total distance and total time, or estimate instantaneous speed by drawing a tangent and finding its gradient.
- Units and dimensional consistency
- Always include units (m/s) and show working.
Label the diagram
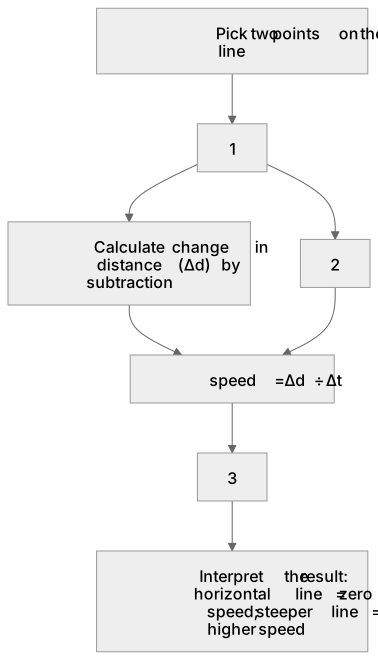
Some boxes have lost their names. Pick the right name for each number.
1Box 1
2Box 2
3Box 3
There is more to this lesson
The full lesson goes on to check your understanding and help you earn the marks. Create a free account to carry on, with your progress saved.
A week of Premium from your first lesson · Then the free plan continues · No card, no charge
Test your understanding of The distance–time relationship: Students should be able to determine speed from a distance–time graph.
Active recall beats re-reading. Take an instant quiz now to test what you’ve learned and lock it into long-term memory.
A week of Premium from your first lesson · Then the free plan continues · No card, no charge