Pearson Edexcel · A-Level · Economics B
Course version: 9EB0 · Version from Sept 2015
D) The factors that may cause a shift in the demand curve: o changes in…
Full specification wording
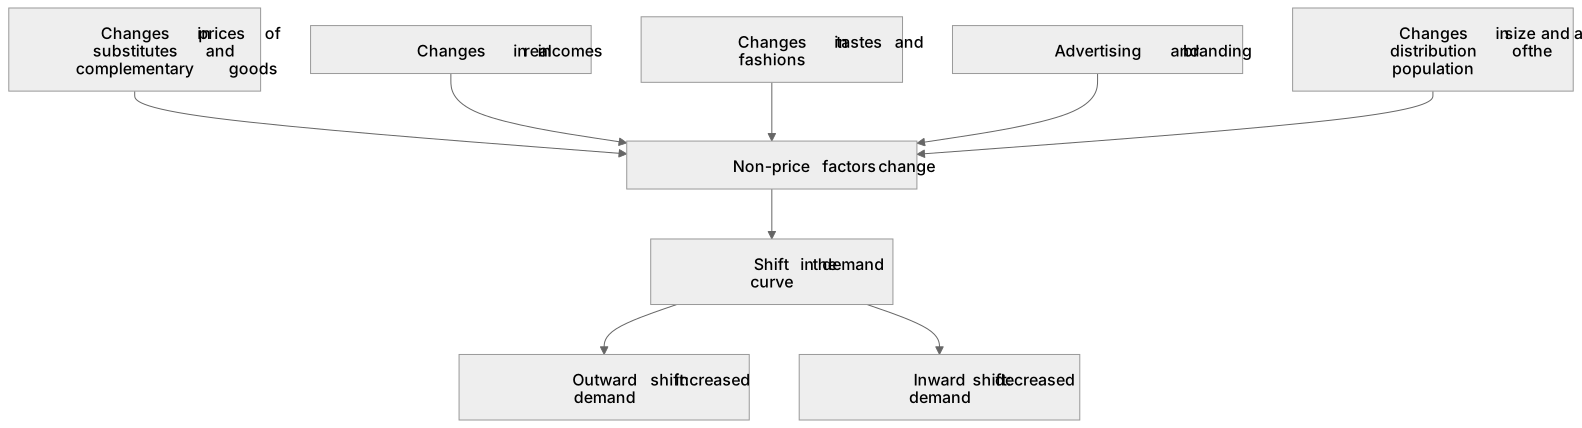
Demand: d) The factors that may cause a shift in the demand curve: o changes in the prices of substitutes and complementary goods o changes in real incomes o changes in tastes and fashions o advertising and branding o changes in size and age distribution of the population
A shift in the demand curve occurs when non-price factors change, altering the quantity demanded at every price level.
Checked against the Pearson Edexcel 9EB0 specification (opens in a new tab) on .
- Point 4 of 4
- 3 key terms
Study notes
From the checked teaching notes for this specification point.
The idea
A shift in the demand curve occurs when non-price factors change, altering the quantity demanded at every price level. An outward shift represents increased demand, while an inward shift shows a decrease. Key factors include changes in the prices of related goods: if a substitute's price (e.g. coffee) rises, demand for tea shifts outwards; if a complement's price (e.g. printers) rises, demand for ink shifts inwards. Changes in real incomes affect purchasing power, shifting demand for normal goods outwards when incomes rise. Tastes, fashions, and successful advertising or branding campaigns increase consumer desire, shifting demand outwards. Finally, demographic changes, such as an increase in population size or an ageing population, shift demand for specific goods like healthcare.
What earns the marks
- Identify that a change in the price of a substitute good causes a shift in the demand curve for the related good in the same direction.
- Explain that an increase in real income shifts the demand curve for a normal good to the right, but shifts the demand curve for an inferior good to the left.
- Recognise that successful advertising and branding campaigns shift the demand curve outwards by increasing consumer loyalty and preference.
- Analyse how an ageing population shifts the demand curve for specific goods and services, such as retirement homes or mobility aids, to the right.
Common mistakes and how to put them right
Confusing a movement along the demand curve with a shift.
Put it right: A movement is caused only by a change in the good's own price, whereas a shift is caused by non-price factors.
Assuming an increase in income always increases demand.
Put it right: This is only true for normal goods, whereas demand for inferior goods will decrease.
Misidentifying the relationship between complementary goods.
Put it right: An increase in the price of a complement causes a decrease in demand for the related good, not an increase.
Exam tips
- Always specify whether a shift in the demand curve is outwards (to the right) or inwards (to the left) rather than just stating that demand changes.
- When evaluating the impact of advertising, consider that its effectiveness in shifting demand depends on the elasticity of the product and competitor actions.
- Use specific demographic examples, such as the UK's ageing population, to contextualise how changes in age distribution affect demand for particular markets.
Try the lesson
The start of the Demand: d) The factors that may cause a shift in the demand curve: o changes in the prices of substitutes and complementary goods o changes in real incomes o changes in tastes and fashions o advertising and branding o changes in size and age distribution of the population lesson, made from checked teaching notes for this specification point.
Have a go first
Which of the following changes would cause the demand curve for a normal good to shift to the right?
Listen
A shift in the demand curve occurs when non-price factors change, altering the quantity demanded at every price level. An outward shift represents increased demand, while an inward shift shows a decrease. Key factors include changes in the prices of related goods: if a substitute's price (e.g. coffee) rises, demand for tea shifts outwards; if a complement's price (e.g. printers) rises, demand for ink shifts inwards. Changes in real incomes affect purchasing power, shifting demand for normal goods outwards when incomes rise. Tastes, fashions, and successful advertising or branding campaigns increase consumer desire, shifting demand outwards. Finally, demographic changes, such as an increase in population size or an ageing population, shift demand for specific goods like healthcare. A strong answer earns marks for these points. Identify that a change in the price of a substitute good causes a shift in the demand curve for the related good in the same direction. Explain that an increase in real income shifts the demand curve for a normal good to the right, but shifts the demand curve for an inferior good to the left. Recognise that successful advertising and branding campaigns shift the demand curve outwards by increasing consumer loyalty and preference. Analyse how an ageing population shifts the demand curve for specific goods and services, such as retirement homes or mobility aids, to the right. Exam tip: Always specify whether a shift in the demand curve is outwards (to the right) or inwards (to the left) rather than just stating that demand changes.
See it
Key words
Say what each word means before you turn the card.
Non-price determinants
Try answering aloud or in your head before turning the card.
Substitutes
Try answering aloud or in your head before turning the card.
Complementary goods
Try answering aloud or in your head before turning the card.
See every definition
- Non-price determinants
- Factors other than the good's own price that cause a shift in the demand curve, altering the quantity demanded at every price level.
- Substitutes
- Related goods where a rise in one good's price shifts demand for the other good outwards, in the same direction.
- Complementary goods
- Related goods where a rise in one good's price causes a decrease in demand for the other good, shifting its demand curve inwards.
Label the diagram
Some boxes have lost their names. Pick the right name for each number.
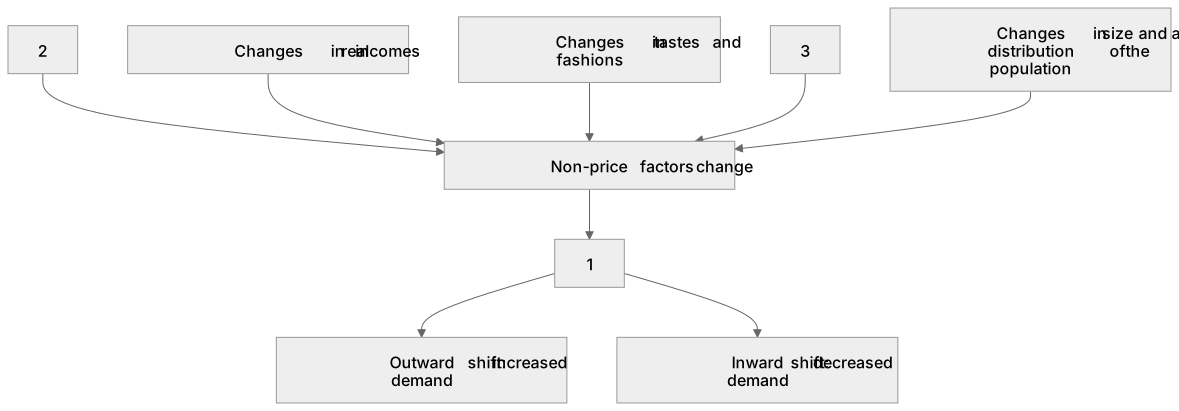
1Box 1
2Box 2
3Box 3
There is more to this lesson
The full lesson goes on to check your understanding and help you earn the marks. Create a free account to carry on, with your progress saved.
A week of Premium from your first lesson · Then the free plan continues · No card, no charge
Test your understanding of Demand: d) The factors that may cause a shift in the demand curve: o changes in the prices of substitutes and complementary goods o changes in real incomes o changes in tastes and fashions o advertising and branding o changes in size and age distribution of the population
Active recall beats re-reading. Take an instant quiz now to test what you’ve learned and lock it into long-term memory.
A week of Premium from your first lesson · Then the free plan continues · No card, no charge