Pearson Edexcel · A-Level · Economics B
Course version: 9EB0 · Version from Sept 2015
Exchange rates: c) Interpretation of exchange rate data
Interpreting exchange rate data involves analysing the value of one currency against another over time.
Checked against the Pearson Edexcel 9EB0 specification (opens in a new tab) on .
- Point 3 of 4
- 4 key terms
Study notes
From the checked teaching notes for this specification point.
The idea
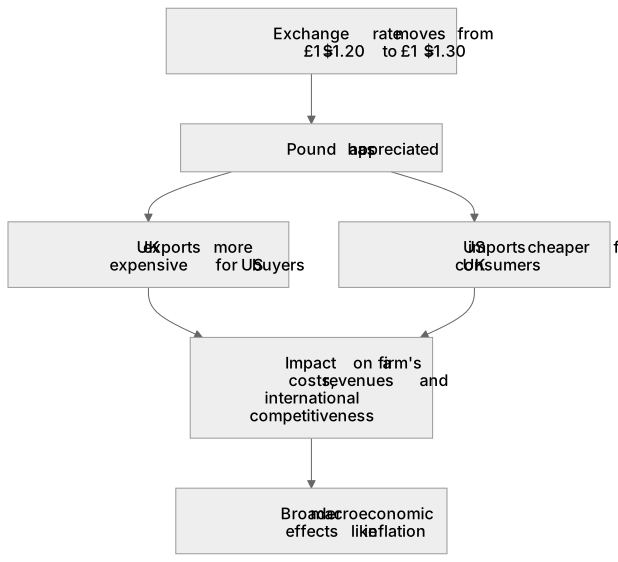
Interpreting exchange rate data involves analysing the value of one currency against another over time. For example, if the exchange rate moves from £1 = $1.20 to £1 = $1.30, the pound has appreciated. This makes UK exports more expensive for US buyers, while US imports become cheaper for UK consumers. Understanding these movements is crucial for evaluating the impact on a firm's costs, revenues, and international competitiveness, as well as broader macroeconomic effects like inflation.
What earns the marks
- Identify whether a currency has appreciated or depreciated from a given data set or chart.
- Calculate the new price of an imported or exported good following an exchange rate change.
- Calculate the percentage change in an exchange rate over a specified period.
- Interpret index numbers to determine the relative strength or weakness of a currency compared to a base year.
Common mistakes and how to put them right
Confusing appreciation with depreciation when reading a currency pair (e.g., thinking a rise in the GBP/USD rate means the dollar has strengthened).
Put it right: If the number increases in a GBP/USD quote, one pound buys more dollars, meaning the pound has appreciated and the dollar has depreciated.
Incorrectly calculating the foreign currency price of an export.
Put it right: Multiply the domestic price by the exchange rate (e.g., a £100 export at £1 = $1.20 costs $120).
Assuming an exchange rate index directly shows the nominal exchange rate.
Put it right: An index shows the percentage change relative to a base year (where the index = 100), not the actual currency value.
Exam tips
- Always check which currency is the base currency in a given exchange rate quote before performing calculations.
- When calculating percentage changes in exchange rates, ensure you use the original value as the denominator.
- Use the acronym SPICED (Strong Pound Imports Cheap Exports Dear) to quickly recall the effects of an appreciation on trade prices.
Try the lesson
The start of the Exchange rates: c) Interpretation of exchange rate data lesson, made from checked teaching notes for this specification point.
Have a go first
An exchange rate table shows that the exchange rate between the UK pound (£) and the euro (€) changed from £1 = €1.15 to £1 = €1.20. How should this data be interpreted?
Listen
Interpreting exchange rate data involves analysing the value of one currency against another over time. For example, if the exchange rate moves from £1 = 1.20 to £1 = 1.30, the pound has appreciated. This makes UK exports more expensive for US buyers, while US imports become cheaper for UK consumers. Understanding these movements is crucial for evaluating the impact on a firm's costs, revenues, and international competitiveness, as well as broader macroeconomic effects like inflation. A strong answer earns marks for these points. Identify whether a currency has appreciated or depreciated from a given data set or chart. Calculate the new price of an imported or exported good following an exchange rate change. Calculate the percentage change in an exchange rate over a specified period. Interpret index numbers to determine the relative strength or weakness of a currency compared to a base year. A common slip: Confusing appreciation with depreciation when reading a currency pair (e.g., thinking a rise in the GBP/USD rate means the dollar has strengthened). Instead, if the number increases in a GBP/USD quote, one pound buys more dollars, meaning the pound has appreciated and the dollar has depreciated. Exam tip: Always check which currency is the base currency in a given exchange rate quote before performing calculations.
See it
Key words
Say what each word means before you turn the card.
Appreciation
Try answering aloud or in your head before turning the card.
Depreciation
Try answering aloud or in your head before turning the card.
Index numbers
Try answering aloud or in your head before turning the card.
International competitiveness
Try answering aloud or in your head before turning the card.
See every definition
- Appreciation
- A rise in the value of one currency against another, for example when the exchange rate moves from £1 = $1.20 to £1 = $1.30.
- Depreciation
- A fall in the value of one currency against another, meaning one pound buys fewer dollars.
- Index numbers
- Figures showing the percentage change relative to a base year, where the index equals 100, rather than the actual currency value.
- International competitiveness
- The ability of a firm to compete internationally, which exchange rate movements affect alongside a firm's costs and revenues.
Label the diagram
Some boxes have lost their names. Pick the right name for each number.

1Box 1
2Box 2
3Box 3
There is more to this lesson
The full lesson goes on to check your understanding and help you earn the marks. Create a free account to carry on, with your progress saved.
A week of Premium from your first lesson · Then the free plan continues · No card, no charge
Test your understanding of Exchange rates: c) Interpretation of exchange rate data
Active recall beats re-reading. Take an instant quiz now to test what you’ve learned and lock it into long-term memory.
A week of Premium from your first lesson · Then the free plan continues · No card, no charge