Pearson Edexcel · A-Level · Economics B
Course version: 9EB0 · Version from Sept 2015
B) The use of supply and demand diagrams to depict excess supply and…
Full specification wording
Price determination: b) The use of supply and demand diagrams to depict excess supply and excess demand
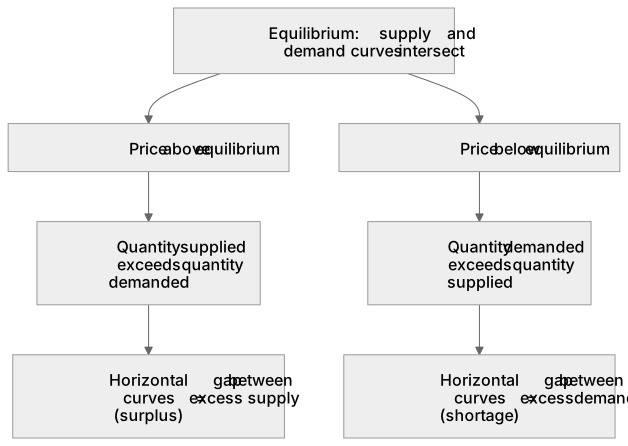
Excess supply occurs when a market price is above equilibrium, meaning quantity supplied exceeds quantity demanded.
Checked against the Pearson Edexcel 9EB0 specification (opens in a new tab) on .
- Point 2 of 5
- 4 key terms
Study notes
From the checked teaching notes for this specification point.
The idea
Excess supply occurs when a market price is above equilibrium, meaning quantity supplied exceeds quantity demanded. On a diagram, this is depicted by a horizontal price line above the equilibrium intersection. The horizontal distance between the demand and supply curves at this price represents the excess supply, or surplus. Conversely, excess demand happens when the price is below equilibrium, where quantity demanded outstrips quantity supplied. This is shown by a horizontal price line below equilibrium, with the gap between the curves illustrating the excess demand, or shortage. If concert tickets are priced too low, the diagram depicts the shortage as the horizontal distance between the supply and demand curves at that specific price.
What earns the marks
- Identify the equilibrium price and quantity where the supply and demand curves intersect.
- Draw a horizontal line above the equilibrium price to show excess supply.
- Label the horizontal distance between the demand and supply curves at a high price as excess supply or surplus.
- Draw a horizontal line below the equilibrium price to show excess demand.
- Label the horizontal distance between the supply and demand curves at a low price as excess demand or shortage.
Common mistakes and how to put them right
Confusing excess supply with excess demand.
Put it right: Excess supply occurs above equilibrium and excess demand occurs below equilibrium.
Measuring the excess vertically instead of horizontally.
Put it right: Excess supply and demand are quantities, so they must be measured on the horizontal axis between the two curves.
Shifting the supply or demand curves to show excess.
Put it right: Excess supply and demand are caused by price levels, so they are shown as movements along the existing curves, not shifts.
Exam tips
- Always label the exact horizontal gap between the curves to clearly indicate the magnitude of the excess supply or demand.
- Use dashed lines to connect the price level to the corresponding quantities on the horizontal axis.
- Double-check that your excess demand is shown at a price below the market equilibrium.
Try the lesson
The start of the Price determination: b) The use of supply and demand diagrams to depict excess supply and excess demand lesson, made from checked teaching notes for this specification point.
Have a go first
On a standard supply and demand diagram, which of the following price levels will depict excess supply?
Listen
Excess supply occurs when a market price is above equilibrium, meaning quantity supplied exceeds quantity demanded. On a diagram, this is depicted by a horizontal price line above the equilibrium intersection. The horizontal distance between the demand and supply curves at this price represents the excess supply, or surplus. Conversely, excess demand happens when the price is below equilibrium, where quantity demanded outstrips quantity supplied. This is shown by a horizontal price line below equilibrium, with the gap between the curves illustrating the excess demand, or shortage. If concert tickets are priced too low, the diagram depicts the shortage as the horizontal distance between the supply and demand curves at that specific price. A strong answer earns marks for these points. Identify the equilibrium price and quantity where the supply and demand curves intersect. Draw a horizontal line above the equilibrium price to show excess supply. Label the horizontal distance between the demand and supply curves at a high price as excess supply or surplus. Draw a horizontal line below the equilibrium price to show excess demand. A common slip: Confusing excess supply with excess demand. Instead, excess supply occurs above equilibrium and excess demand occurs below equilibrium. Exam tip: Always label the exact horizontal gap between the curves to clearly indicate the magnitude of the excess supply or demand.
See it
Key words
Say what each word means before you turn the card.
Excess supply
Try answering aloud or in your head before turning the card.
Excess demand
Try answering aloud or in your head before turning the card.
Surplus
Try answering aloud or in your head before turning the card.
Shortage
Try answering aloud or in your head before turning the card.
See every definition
- Excess supply
- Occurs when a market price is above equilibrium, meaning quantity supplied exceeds quantity demanded.
- Excess demand
- Happens when the price is below equilibrium, where quantity demanded outstrips quantity supplied.
- Surplus
- Shown on a diagram as the horizontal distance between the demand and supply curves at a price above equilibrium.
- Shortage
- Illustrated by the gap between the curves at a price below equilibrium, representing excess demand.
Label the diagram
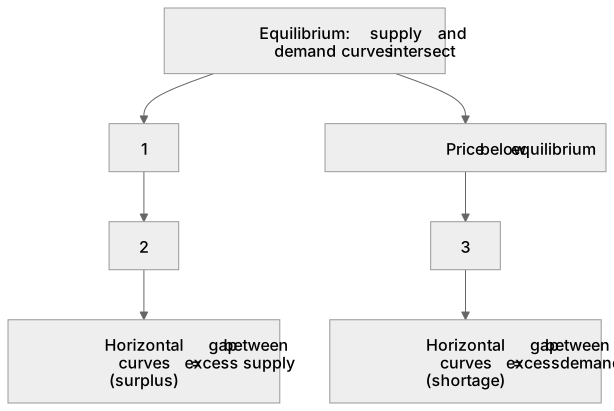
Some boxes have lost their names. Pick the right name for each number.
1Box 1
2Box 2
3Box 3
There is more to this lesson
The full lesson goes on to check your understanding and help you earn the marks. Create a free account to carry on, with your progress saved.
A week of Premium from your first lesson · Then the free plan continues · No card, no charge
Test your understanding of Price determination: b) The use of supply and demand diagrams to depict excess supply and excess demand
Active recall beats re-reading. Take an instant quiz now to test what you’ve learned and lock it into long-term memory.
A week of Premium from your first lesson · Then the free plan continues · No card, no charge