Pearson Edexcel · A-Level · Economics B
Course version: 9EB0 · Version from Sept 2015
A) Primary and secondary market research data (quantitative and…
Full specification wording
Understanding the consumer: a) Primary and secondary market research data (quantitative and qualitative) used to quantify likely demand and gain insight into consumer behaviour
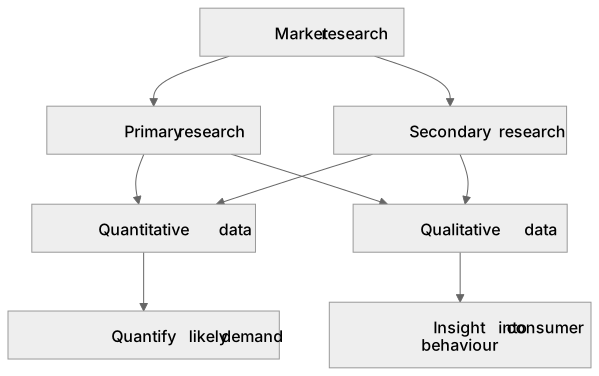
Market research allows businesses to quantify likely demand and gain insight into consumer behaviour.
Checked against the Pearson Edexcel 9EB0 specification (opens in a new tab) on .
- Point 1 of 3
- 4 key terms
Study notes
From the checked teaching notes for this specification point.
The idea
Market research allows businesses to quantify likely demand and gain insight into consumer behaviour. Primary research involves collecting new data directly for a specific purpose, such as through surveys or focus groups. Secondary research uses existing data, like government statistics or industry reports. Both can yield quantitative data (numerical data used to measure demand levels) and qualitative data (descriptive data exploring consumer motivations and preferences).
For example: A firm launching a new drink might use secondary quantitative data to assess market size, and primary qualitative data from focus groups to understand why consumers prefer certain flavours.
What earns the marks
- Primary research is gathered first-hand for a specific purpose, whereas secondary research already exists.
- Quantitative data provides numerical insights to estimate the volume of likely demand.
- Qualitative data offers descriptive insights into consumer attitudes, opinions, and buying behaviour.
- Businesses combine these methods to reduce risk and make informed decisions about product development and marketing.
Common mistakes and how to put them right
Confusing primary and secondary research.
Put it right: Primary is new data collected by the firm, not just the most important data; secondary is pre-existing data.
Assuming quantitative data explains 'why'.
Put it right: Quantitative data shows 'how much' or 'how many', while qualitative data explains the reasons behind consumer choices.
Believing secondary research is always cheaper and faster.
Put it right: While often true, accessing specialised secondary industry reports can be expensive.
Exam tips
- Always link the type of market research chosen to the specific context of the business in the case study.
- Use quantitative data to support arguments about market size or potential sales volume.
- Evaluate the usefulness of qualitative data when discussing how a business might adapt its product to meet consumer preferences.
Try the lesson
The start of the Understanding the consumer: a) Primary and secondary market research data (quantitative and qualitative) used to quantify likely demand and gain insight into consumer behaviour lesson, made from checked teaching notes for this specification point.
Have a go first
Which of the following is an example of primary qualitative market research used to gain insight into consumer behaviour?
Listen
Market research allows businesses to quantify likely demand and gain insight into consumer behaviour. Primary research involves collecting new data directly for a specific purpose, such as through surveys or focus groups. Secondary research uses existing data, like government statistics or industry reports. Both can yield quantitative data (numerical data used to measure demand levels) and qualitative data (descriptive data exploring consumer motivations and preferences). For example, a firm launching a new drink might use secondary quantitative data to assess market size, and primary qualitative data from focus groups to understand why consumers prefer certain flavours. A strong answer earns marks for these points. Primary research is gathered first-hand for a specific purpose, whereas secondary research already exists. Quantitative data provides numerical insights to estimate the volume of likely demand. Qualitative data offers descriptive insights into consumer attitudes, opinions, and buying behaviour. Businesses combine these methods to reduce risk and make informed decisions about product development and marketing. Exam tip: Always link the type of market research chosen to the specific context of the business in the case study.
See it
Key words
Say what each word means before you turn the card.
Market research
Try answering aloud or in your head before turning the card.
Primary research
Try answering aloud or in your head before turning the card.
Secondary research
Try answering aloud or in your head before turning the card.
Quantitative data
Try answering aloud or in your head before turning the card.
See every definition
- Market research
- Collecting primary and secondary data to quantify likely demand and gain insight into consumer behaviour.
- Primary research
- Gathering new data first-hand for a specific purpose, such as through surveys or focus groups.
- Secondary research
- Using data that already exists, like government statistics or industry reports.
- Quantitative data
- Numerical data used to measure demand levels and estimate the volume of likely demand.
Label the diagram
Some boxes have lost their names. Pick the right name for each number.
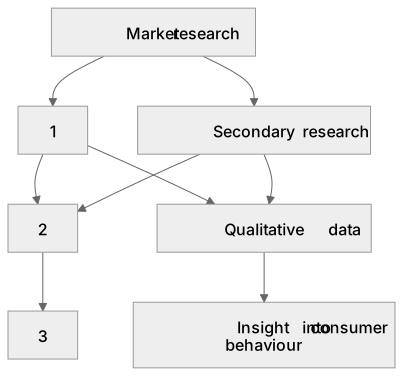
1Box 1
2Box 2
3Box 3
There is more to this lesson
The full lesson goes on to check your understanding and help you earn the marks. Create a free account to carry on, with your progress saved.
A week of Premium from your first lesson · Then the free plan continues · No card, no charge
Test your understanding of Understanding the consumer: a) Primary and secondary market research data (quantitative and qualitative) used to quantify likely demand and gain insight into consumer behaviour
Active recall beats re-reading. Take an instant quiz now to test what you’ve learned and lock it into long-term memory.
A week of Premium from your first lesson · Then the free plan continues · No card, no charge