AQA · A-Level · Geography
Course version: 7037 · Version from Sept 2018
Maps showing spatial patterns – choropleth, isoline and dot maps.
Full specification wording
Cartographic skills: Maps showing spatial patterns – choropleth, isoline and dot maps.
Spatial patterns reveal how geographical phenomena are distributed across an area.
Checked against the AQA 7037 specification (opens in a new tab) on .
- Point 5 of 5
- 4 key terms
Study notes
From the checked teaching notes for this specification point.
The idea
Spatial patterns reveal how geographical phenomena are distributed across an area. Choropleth maps use colour shading or patterns to represent average values within predefined administrative boundaries, such as population density per km². They are visually striking but can falsely imply abrupt changes at borders. Isoline maps connect points of equal value using continuous lines, ideal for gradual transitions like temperature isotherms or elevation contours, avoiding artificial boundaries. Dot maps use identical dots to represent a specific quantity of a variable, such as one dot per 10,000 people. This method accurately shows spatial clustering and dispersion but becomes difficult to interpret if dots overlap heavily in dense areas.
What earns the marks
- Identify the appropriate map type for a given dataset, such as continuous data for isolines or discrete totals for dot maps.
- Interpret spatial trends, anomalies, and clusters from choropleth, isoline, and dot maps.
- Evaluate the limitations of choropleth maps, specifically the assumption of uniform distribution within boundaries.
- Calculate values or estimate gradients between isolines using interpolation techniques.
Common mistakes and how to put them right
Assuming data in a choropleth map is evenly distributed within a boundary.
Put it right: Recognise that choropleth maps mask internal variations and show an average or total for the whole area.
Misinterpreting dot maps by assuming a dot represents the exact location of a single feature.
Put it right: Understand that a dot represents a specific quantity and is placed randomly within the area it represents.
Believing isolines can cross each other.
Put it right: Isolines connect points of equal value, so they can never intersect, though they may converge on vertical cliffs.
Exam tips
- Always check the key or legend first to determine the class intervals on a choropleth map or the value of a single dot.
- When describing spatial patterns, use specific compass directions and reference named locations or anomalies shown on the map.
- Critique map choices by discussing whether the data is continuous, favouring isolines, or discrete, favouring dot maps.
Try the lesson
The start of the Cartographic skills: Maps showing spatial patterns – choropleth, isoline and dot maps. lesson, made from checked teaching notes for this specification point.
Have a go first
A geographer is mapping atmospheric pressure across the United Kingdom to identify weather systems. Which type of map uses continuous lines to connect points of equal pressure to show these spatial patterns?
Listen
Spatial patterns reveal how geographical phenomena are distributed across an area. Choropleth maps use colour shading or patterns to represent average values within predefined administrative boundaries, such as population density per km². They are visually striking but can falsely imply abrupt changes at borders. Isoline maps connect points of equal value using continuous lines, ideal for gradual transitions like temperature isotherms or elevation contours, avoiding artificial boundaries. Dot maps use identical dots to represent a specific quantity of a variable, such as one dot per 10,000 people. This method accurately shows spatial clustering and dispersion but becomes difficult to interpret if dots overlap heavily in dense areas. A strong answer earns marks for these points. Identify the appropriate map type for a given dataset, such as continuous data for isolines or discrete totals for dot maps. Interpret spatial trends, anomalies, and clusters from choropleth, isoline, and dot maps. Evaluate the limitations of choropleth maps, specifically the assumption of uniform distribution within boundaries. Calculate values or estimate gradients between isolines using interpolation techniques. A common slip: Assuming data in a choropleth map is evenly distributed within a boundary. Instead, Recognise that choropleth maps mask internal variations and show an average or total for the whole area. Exam tip: Always check the key or legend first to determine the class intervals on a choropleth map or the value of a single dot.
See it

Key words
Say what each word means before you turn the card.
Spatial patterns
Try answering aloud or in your head before turning the card.
Choropleth maps
Try answering aloud or in your head before turning the card.
Isoline maps
Try answering aloud or in your head before turning the card.
Dot maps
Try answering aloud or in your head before turning the card.
See every definition
- Spatial patterns
- How geographical phenomena are distributed across an area, as shown by maps such as choropleth, isoline and dot maps.
- Choropleth maps
- Maps that use colour shading or patterns to represent average values within predefined administrative boundaries, such as population density per km².
- Isoline maps
- Maps that connect points of equal value using continuous lines, ideal for gradual transitions like temperature isotherms or elevation contours, avoiding artificial boundaries.
- Dot maps
- Maps that use identical dots to represent a specific quantity of a variable, such as one dot per 10,000 people, accurately showing spatial clustering and dispersion.
Label the diagram
Some boxes have lost their names. Pick the right name for each number.
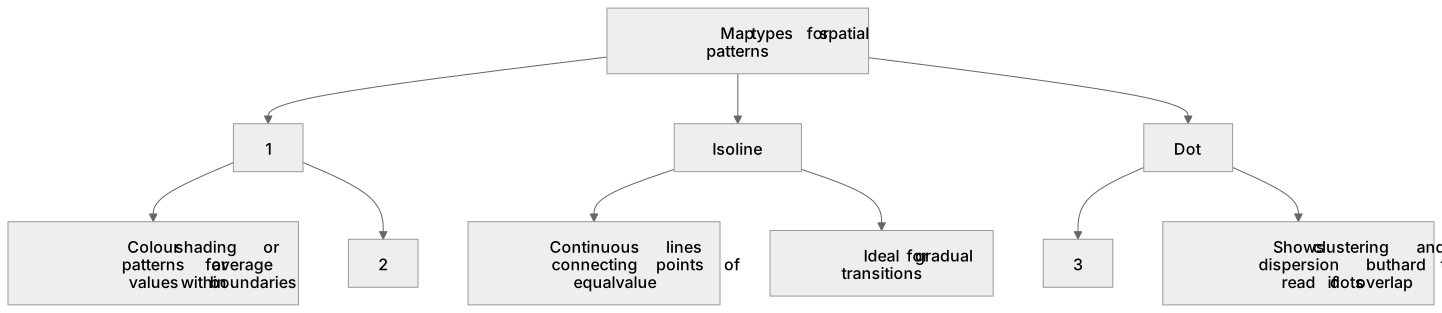
1Box 1
2Box 2
3Box 3
There is more to this lesson
The full lesson goes on to check your understanding and help you earn the marks. Create a free account to carry on, with your progress saved.
A week of Premium from your first lesson · Then the free plan continues · No card, no charge
Test your understanding of Cartographic skills: Maps showing spatial patterns – choropleth, isoline and dot maps.
Active recall beats re-reading. Take an instant quiz now to test what you’ve learned and lock it into long-term memory.
A week of Premium from your first lesson · Then the free plan continues · No card, no charge