AQA · A-Level · Geography
Course version: 7037 · Version from Sept 2018
Cartographic skills: Maps with located proportional symbols.
Located proportional symbols display absolute data values at specific geographic locations.
Checked against the AQA 7037 specification (opens in a new tab) on .
- Point 3 of 5
Study notes
From the checked teaching notes for this specification point.
The idea
Located proportional symbols display absolute data values at specific geographic locations. The area of the symbol, usually a circle, is drawn directly proportional to the data value. To calculate the radius of a proportional circle, find the square root of the data value and multiply it by a chosen scale factor. For example, mapping the population of UK cities requires calculating the square root of each population so the visual weight of the circle accurately reflects the data. These maps are excellent for visualising spatial patterns and comparing magnitudes across regions. However, heavy clustering can cause symbols to overlap, which obscures underlying map features and makes precise data extraction difficult without a clear key.
What earns the marks
- Identify the spatial pattern or distribution shown by the proportional symbols across the mapped area.
- Extract specific data values by comparing the size of located symbols to the provided map key.
- Calculate the required radius for a proportional circle using the square root of the data value and a scale factor.
- Evaluate the effectiveness of the map, noting limitations such as symbol overlap in densely populated or clustered areas.
Common mistakes and how to put them right
Making the radius or diameter proportional to the data value instead of the area.
Put it right: Use the square root of the data value to calculate the radius so that the area is proportional.
Using proportional symbols for relative data like percentages or rates.
Put it right: Only use proportional symbols for absolute raw data, such as total population or total energy generated.
Failing to accurately estimate values that fall between the sizes shown in the key.
Put it right: Interpolate carefully by comparing the symbol's area to the nearest larger and smaller symbols in the key.
Exam tips
- When asked to describe a pattern, always refer to specific locations and use data from the key to support your points.
- If asked to draw a proportional circle, clearly show your working for the square root calculation and the application of the scale factor.
- Look out for overlapping symbols; if evaluating the map's usefulness, mention how overlap can hide smaller symbols or base map details.
Try the lesson
The start of the Cartographic skills: Maps with located proportional symbols. lesson, made from checked teaching notes for this specification point.
Have a go first
On a map with located proportional circles, a town with a population of 40 000 is drawn with a circle of area 4 cm². What area should be used for a town of 160 000 people if the circles are proportional to population?
Listen
Located proportional symbols display absolute data values at specific geographic locations. The area of the symbol, usually a circle, is drawn directly proportional to the data value. To calculate the radius of a proportional circle, find the square root of the data value and multiply it by a chosen scale factor. For example, mapping the population of UK cities requires calculating the square root of each population so the visual weight of the circle accurately reflects the data. These maps are excellent for visualising spatial patterns and comparing magnitudes across regions. However, heavy clustering can cause symbols to overlap, which obscures underlying map features and makes precise data extraction difficult without a clear key. A strong answer earns marks for these points. Identify the spatial pattern or distribution shown by the proportional symbols across the mapped area. Extract specific data values by comparing the size of located symbols to the provided map key. Calculate the required radius for a proportional circle using the square root of the data value and a scale factor. Evaluate the effectiveness of the map, noting limitations such as symbol overlap in densely populated or clustered areas. A common slip: Making the radius or diameter proportional to the data value instead of the area. Instead, use the square root of the data value to calculate the radius so that the area is proportional. Exam tip: When asked to describe a pattern, always refer to specific locations and use data from the key to support your points.
See it
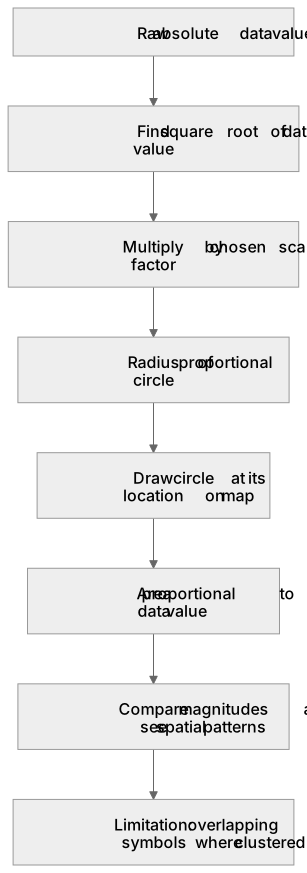
Put it in order
Put these steps in the order they happen.
- 1. Draw circle at its location on map
- 2. Limitation: overlapping symbols where clustered
- 3. Area proportional to data value
- 4. Raw absolute data value
- 5. Find square root of data value
- 6. Compare magnitudes and see spatial patterns
- 7. Multiply by chosen scale factor
- 8. Radius of proportional circle
Label the diagram
Some boxes have lost their names. Pick the right name for each number.
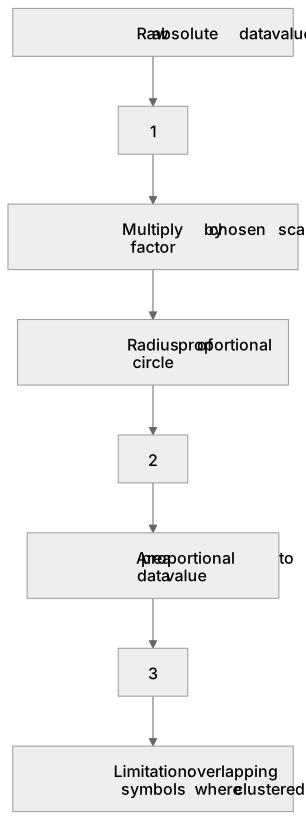
1Box 1
2Box 2
3Box 3
There is more to this lesson
The full lesson goes on to check your understanding and help you earn the marks. Create a free account to carry on, with your progress saved.
A week of Premium from your first lesson · Then the free plan continues · No card, no charge
Test your understanding of Cartographic skills: Maps with located proportional symbols.
Active recall beats re-reading. Take an instant quiz now to test what you’ve learned and lock it into long-term memory.
A week of Premium from your first lesson · Then the free plan continues · No card, no charge