AQA · A-Level · Geography
Course version: 7037 · Version from Sept 2018
Global and regional patterns of food production and consumption.…
Full specification wording
Environment and population: Global and regional patterns of food production and consumption. Agricultural systems and agricultural productivity. Relationship with key physical environmental variables – climate and soils.
Food production and consumption exhibit distinct global and regional patterns, often reflecting economic development and physical geography.
Checked against the AQA 7037 specification (opens in a new tab) on .
- Point 1 of 4
Study notes
From the checked teaching notes for this specification point.
The idea
Food production and consumption exhibit distinct global and regional patterns, often reflecting economic development and physical geography. High-income nations typically consume more calories and protein, while production hotspots include the US Midwest and Southeast Asia. Agricultural systems operate as open systems with inputs (fertilisers, labour), processes (ploughing), and outputs (yields). Productivity, measured in tonnes per hectare (t ha⁻¹), depends heavily on physical variables. Climate dictates growing seasons, temperature, and precipitation, while soils provide essential nutrients and moisture retention.
For example: Deep, nutrient-rich Chernozem soils combined with temperate climates support highly productive intensive wheat farming, whereas arid climates with thin soils restrict systems to extensive pastoralism.
What earns the marks
- Describe global patterns of food consumption, noting the disparity in daily calorie intake between high-income and low-income countries.
- Explain agricultural systems using a systems approach, identifying specific physical inputs, human inputs, processes, and outputs.
- Analyse how agricultural productivity is influenced by climatic factors such as temperature ranges and precipitation totals.
- Evaluate the role of soil characteristics, including depth, texture, and nutrient profile, in determining the viability of specific agricultural systems.
Common mistakes and how to put them right
Confusing food production with agricultural productivity.
Put it right by defining production as the total volume generated, whereas productivity is the efficiency or yield per unit area, such as t ha⁻¹.
Ignoring human factors when discussing patterns.
Put it right by acknowledging that while climate and soils set baseline potential, technology and capital heavily modify regional production.
Treating agricultural systems as closed.
Put it right by defining them as open systems that rely on external inputs like solar radiation and artificial fertilisers.
Exam tips
- Use specific units like t ha⁻¹ when discussing agricultural productivity to demonstrate precise geographical knowledge.
- Always link physical variables directly to farming types, such as explaining how high rainfall and clay soils support intensive wet rice cultivation.
- Contrast a high-input intensive system with a low-input extensive system to effectively illustrate variations in agricultural productivity.
Try the lesson
The start of the Environment and population: Global and regional patterns of food production and consumption. Agricultural systems and agricultural productivity. Relationship with key physical environmental variables – climate and soils. lesson, made from checked teaching notes for this specification point.
Have a go first
Which of the following best describes a general global pattern of food consumption?
Listen
Food production and consumption exhibit distinct global and regional patterns, often reflecting economic development and physical geography. High-income nations typically consume more calories and protein, while production hotspots include the US Midwest and Southeast Asia. Agricultural systems operate as open systems with inputs (fertilisers, labour), processes (ploughing), and outputs (yields). Productivity, measured in tonnes per hectare (t ha⁻¹), depends heavily on physical variables. Climate dictates growing seasons, temperature, and precipitation, while soils provide essential nutrients and moisture retention. For example, deep, nutrient-rich Chernozem soils combined with temperate climates support highly productive intensive wheat farming, whereas arid climates with thin soils restrict systems to extensive pastoralism. A strong answer earns marks for these points. Describe global patterns of food consumption, noting the disparity in daily calorie intake between high-income and low-income countries. Explain agricultural systems using a systems approach, identifying specific physical inputs, human inputs, processes, and outputs. Analyse how agricultural productivity is influenced by climatic factors such as temperature ranges and precipitation totals. Evaluate the role of soil characteristics, including depth, texture, and nutrient profile, in determining the viability of specific agricultural systems. A common slip: Confusing food production with agricultural productivity. Instead, defining production as the total volume generated, whereas productivity is the efficiency or yield per unit area, such as t ha⁻¹. Exam tip: Use specific units like t ha⁻¹ when discussing agricultural productivity to demonstrate precise geographical knowledge.
See it
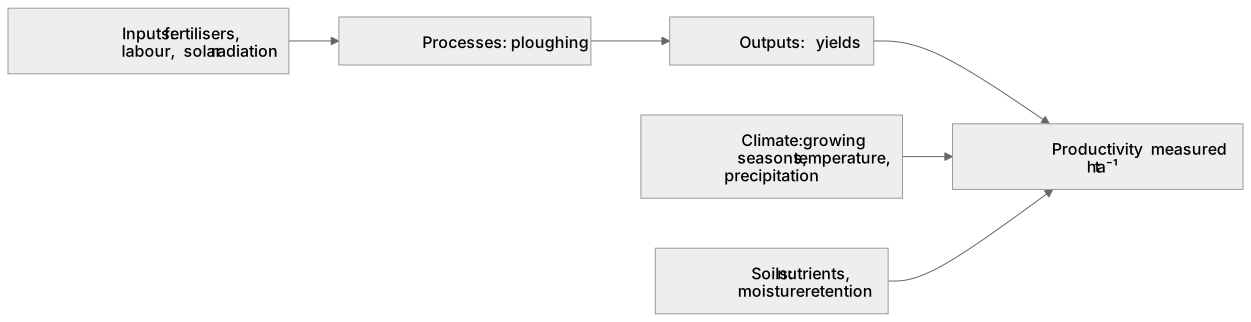
Label the diagram
Some boxes have lost their names. Pick the right name for each number.
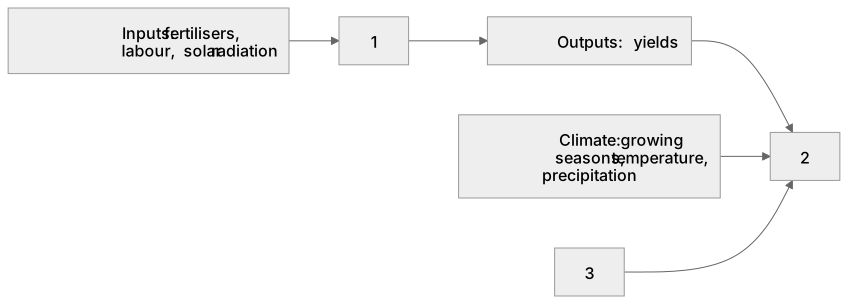
1Box 1
2Box 2
3Box 3
There is more to this lesson
The full lesson goes on to check your understanding and help you earn the marks. Create a free account to carry on, with your progress saved.
A week of Premium from your first lesson · Then the free plan continues · No card, no charge
Test your understanding of Environment and population: Global and regional patterns of food production and consumption. Agricultural systems and agricultural productivity. Relationship with key physical environmental variables – climate and soils.
Active recall beats re-reading. Take an instant quiz now to test what you’ve learned and lock it into long-term memory.
A week of Premium from your first lesson · Then the free plan continues · No card, no charge