AQA · A-Level · Geography
Course version: 7037 · Version from Sept 2018
Factors in natural population change: the demographic transition model,…
Full specification wording
Population change: Factors in natural population change: the demographic transition model, key vital rates, age–sex composition; cultural controls. Models of natural population change, and their application in contrasting physical and human settings. Concept of the Demographic Dividend.
Natural population change is driven by vital rates, specifically crude birth and death rates (per 1000 people).
Checked against the AQA 7037 specification (opens in a new tab) on .
- Point 1 of 2
- 3 key terms
Study notes
From the checked teaching notes for this specification point.
The idea
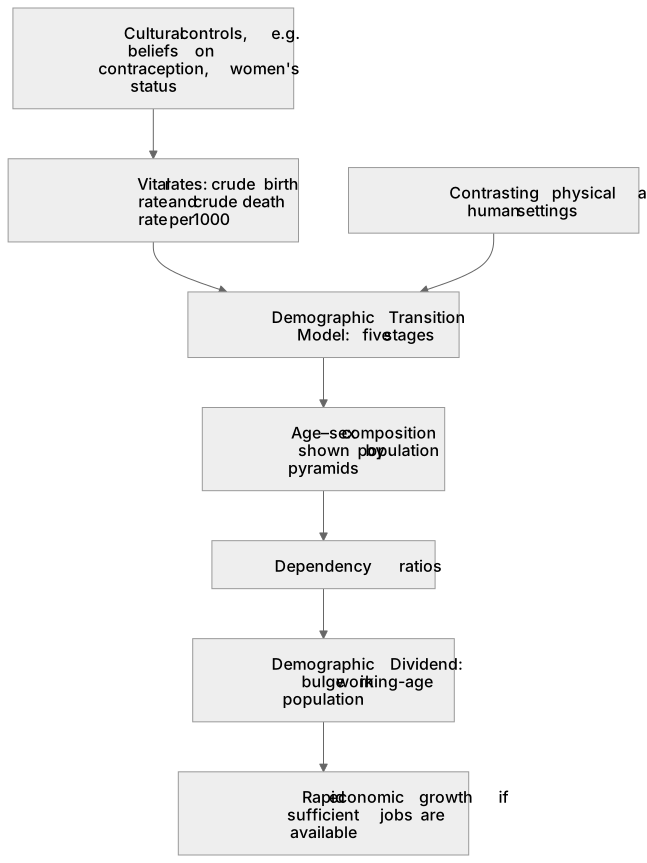
Natural population change is driven by vital rates, specifically crude birth and death rates (per 1000 people). The Demographic Transition Model (DTM) charts these changes across five stages. Age-sex composition, visualised via population pyramids, reveals dependency ratios. Cultural controls, such as beliefs on contraception or women's status, heavily influence fertility. Applying models to contrasting settings shows how physical factors (e.g., harsh climates) and human factors (e.g., urbanisation) alter transition speeds. The Demographic Dividend occurs when falling birth rates create a bulge in the working-age population, offering a window for rapid economic growth if sufficient jobs are available.
What earns the marks
- Define and calculate key vital rates, including crude birth rate, crude death rate, and natural increase, expressing them accurately per 1000 of the population.
- Analyse the five stages of the Demographic Transition Model, explaining the socio-economic reasons for the changing relationship between birth and death rates.
- Interpret age-sex population pyramids to assess dependency ratios, life expectancy, and the impact of cultural controls like gender preferences or family planning policies.
- Evaluate the concept of the Demographic Dividend, explaining how a declining dependency ratio can stimulate economic growth, provided there is adequate investment in education and job creation.
- Apply population models to contrasting physical (e.g., resource-poor vs. resource-rich environments) and human (e.g., agrarian vs. post-industrial societies) settings.
Common mistakes and how to put them right
Confusing natural population change with overall population change.
Put it right: Explicitly state that natural change only accounts for births and deaths, whereas overall change also includes net migration.
Assuming the Demographic Dividend is an automatic economic benefit of falling birth rates.
Put it right: Emphasise that the dividend is only realised if the government invests in human capital and creates sufficient employment for the growing workforce.
Treating the DTM as a universal rule that applies equally to all countries.
Put it right: Acknowledge the DTM's Eurocentric limitations and explain how cultural controls or physical settings can cause developing nations to skip stages or stall.
Exam tips
- When discussing vital rates, always specify that crude birth and death rates are measured per 1000 people per year to ensure mathematical accuracy.
- Use specific contrasting case studies, such as a Stage 2 Sub-Saharan African country and a Stage 5 European country, to illustrate how human and physical settings alter population models.
- Link age-sex composition directly to the Demographic Dividend by explaining how a wide middle section of a population pyramid represents a low dependency ratio.
Try the lesson
The start of the Population change: Factors in natural population change: the demographic transition model, key vital rates, age–sex composition; cultural controls. Models of natural population change, and their application in contrasting physical and human settings. Concept of the Demographic Dividend. lesson, made from checked teaching notes for this specification point.
Have a go first
Which of the following conditions is essential for a country to experience a demographic dividend?
Listen
Natural population change is driven by vital rates, specifically crude birth and death rates (per 1000 people). The Demographic Transition Model (DTM) charts these changes across five stages. Age-sex composition, visualised via population pyramids, reveals dependency ratios. Cultural controls, such as beliefs on contraception or women's status, heavily influence fertility. Applying models to contrasting settings shows how physical factors (e.g., harsh climates) and human factors (e.g., urbanisation) alter transition speeds. The Demographic Dividend occurs when falling birth rates create a bulge in the working-age population, offering a window for rapid economic growth if sufficient jobs are available. A strong answer earns marks for these points. Define and calculate key vital rates, including crude birth rate, crude death rate, and natural increase, expressing them accurately per 1000 of the population. Analyse the five stages of the Demographic Transition Model, explaining the socio-economic reasons for the changing relationship between birth and death rates. Interpret age-sex population pyramids to assess dependency ratios, life expectancy, and the impact of cultural controls like gender preferences or family planning policies. Evaluate the concept of the Demographic Dividend, explaining how a declining dependency ratio can stimulate economic growth, provided there is adequate investment in education and job creation. A common slip: Confusing natural population change with overall population change. Instead, Explicitly state that natural change only accounts for births and deaths, whereas overall change also includes net migration. Exam tip: When discussing vital rates, always specify that crude birth and death rates are measured per 1000 people per year to ensure mathematical accuracy.
See it
Key words
Say what each word means before you turn the card.
Population structure
Try answering aloud or in your head before turning the card.
Cultural controls
Try answering aloud or in your head before turning the card.
Demographic Dividend
Try answering aloud or in your head before turning the card.
See every definition
- Population structure
- Age–sex composition, visualised via population pyramids, which reveals dependency ratios.
- Cultural controls
- Beliefs such as those on contraception or women's status that heavily influence fertility.
- Demographic Dividend
- A window offering rapid economic growth when falling birth rates create a bulge in the working-age population, if sufficient jobs are available.
Label the diagram
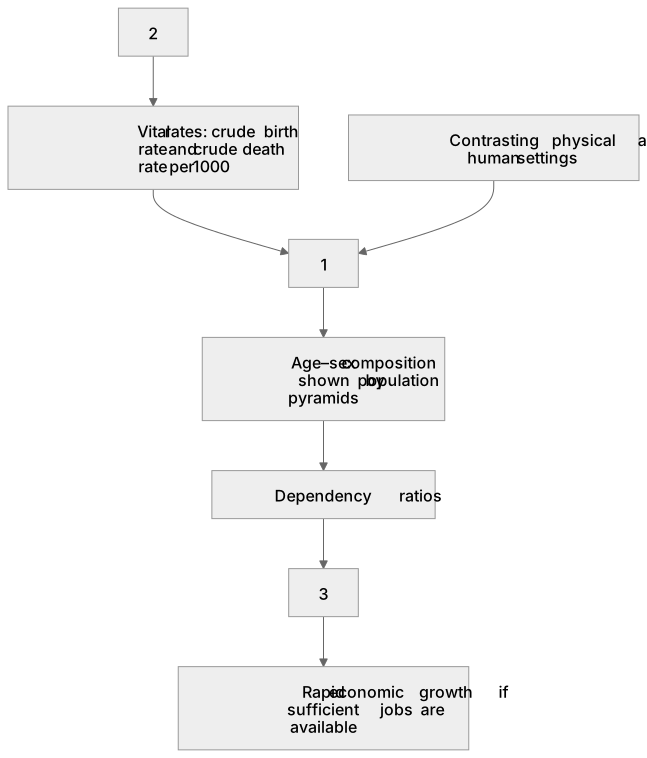
Some boxes have lost their names. Pick the right name for each number.
1Box 1
2Box 2
3Box 3
There is more to this lesson
The full lesson goes on to check your understanding and help you earn the marks. Create a free account to carry on, with your progress saved.
A week of Premium from your first lesson · Then the free plan continues · No card, no charge
Test your understanding of Population change: Factors in natural population change: the demographic transition model, key vital rates, age–sex composition; cultural controls. Models of natural population change, and their application in contrasting physical and human settings. Concept of the Demographic Dividend.
Active recall beats re-reading. Take an instant quiz now to test what you’ve learned and lock it into long-term memory.
A week of Premium from your first lesson · Then the free plan continues · No card, no charge