AQA · A-Level · Geography
Course version: 7037 · Version from Sept 2018
Inferential and relational statistical techniques to include Spearman’s…
Full specification wording
Statistical skills: Inferential and relational statistical techniques to include Spearman’s rank correlation and Chi-square test and the application of significance tests.
Inferential and relational statistics test whether a sample pattern provides evidence against a null hypothesis.
Checked against the AQA 7037 specification (opens in a new tab) on .
- Point 3 of 3
- 4 key terms
Study notes
From the checked teaching notes for this specification point.
The idea
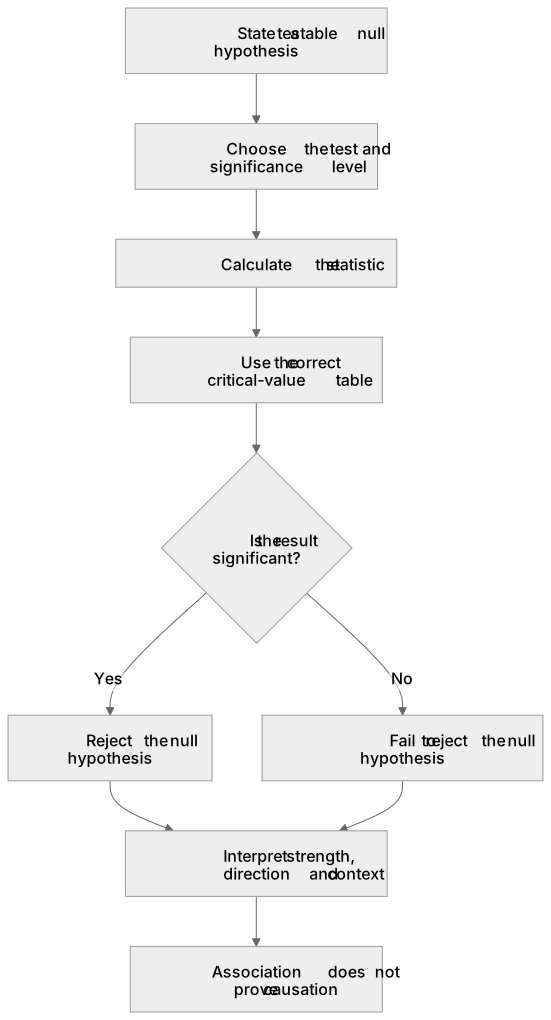
Inferential and relational statistics test whether a sample pattern provides evidence against a null hypothesis. Spearman’s rank correlation measures the strength and direction of a monotonic association between paired ranked observations, such as river velocity and distance downstream. Chi-square compares observed and expected frequencies for categorical data, either for association in a contingency table or for a stated expected distribution. For a significance test, choose the test and significance level before interpreting results, calculate the statistic, and use the correct critical-value table. Spearman tables are entered with n, the number of valid pairs; Chi-square uses degrees of freedom, (rows − 1)(columns − 1) for association. If the result is significant, reject the null hypothesis; otherwise fail to reject it. Statistical association does not by itself prove causation.
What earns the marks
- State a testable null hypothesis before analysis and identify the paired ranked data or categorical frequencies being tested.
- For Spearman's rank, rank each variable consistently, calculate the coefficient and use n, the number of valid pairs, to select the critical value.
- For Chi-square association, calculate expected frequencies and degrees of freedom as (rows − 1)(columns − 1), then compare the statistic with the correct critical value.
- State the chosen significance level, reject the null hypothesis only when the result is significant, and otherwise report that there is insufficient evidence to reject it.
- Interpret strength, direction and context without treating statistical association as proof of causation.
Common mistakes and how to put them right
Writing a vague null hypothesis.
Put it right: Name the variables or categories and state that there is no statistically significant association, correlation or difference as appropriate.
Treating a negative Spearman coefficient as weak.
Put it right: The sign gives direction while the absolute value indicates strength.
Using n − 2 as Spearman's degrees of freedom.
Put it right: Use the AQA critical-value table row for n valid pairs, while degrees of freedom apply to Chi-square.
Saying the null hypothesis is accepted when a result is not significant.
Put it right: Report that you fail to reject it because the sample gives insufficient evidence.
Using Chi-square on raw continuous measurements.
Put it right: It requires observed frequencies in meaningful categories and suitable expected counts.
Exam tips
- Write the null hypothesis and significance level before calculating so the decision rule is clear.
- For Spearman, check tied-rank handling and count the valid pairs; for Chi-square, show observed and expected frequencies and the degrees-of-freedom calculation.
- Use 'significant at p ≤ 0.05' or 'not significant at p ≤ 0.05' as appropriate, then reject or fail to reject the null hypothesis.
- Finish with a contextual interpretation and state that a significant association alone does not demonstrate causation.
Try the lesson
The start of the Statistical skills: Inferential and relational statistical techniques to include Spearman’s rank correlation and Chi-square test and the application of significance tests. lesson, made from checked teaching notes for this specification point.
Have a go first
A geographer is investigating whether there is a relationship between the type of coastal management strategy used (e.g., sea wall, groynes, none) and the dominant wave type (constructive, destructive) across 30 different beaches. Which statistical test is most appropriate for analysing this data?
Listen
Inferential and relational statistics test whether a sample pattern provides evidence against a null hypothesis. Spearman’s rank correlation measures the strength and direction of a monotonic association between paired ranked observations, such as river velocity and distance downstream. Chi-square compares observed and expected frequencies for categorical data, either for association in a contingency table or for a stated expected distribution. For a significance test, choose the test and significance level before interpreting results, calculate the statistic, and use the correct critical-value table. Spearman tables are entered with n, the number of valid pairs; Chi-square uses degrees of freedom, (rows − 1)(columns − 1) for association. If the result is significant, reject the null hypothesis; otherwise fail to reject it. Statistical association does not by itself prove causation. A strong answer earns marks for these points. State a testable null hypothesis before analysis and identify the paired ranked data or categorical frequencies being tested. For Spearman's rank, rank each variable consistently, calculate the coefficient and use n, the number of valid pairs, to select the critical value. For Chi-square association, calculate expected frequencies and degrees of freedom as (rows − 1)(columns − 1), then compare the statistic with the correct critical value. State the chosen significance level, reject the null hypothesis only when the result is significant, and otherwise report that there is insufficient evidence to reject it. A common slip: Writing a vague null hypothesis. Instead, name the variables or categories and state that there is no statistically significant association, correlation or difference as appropriate. Exam tip: Write the null hypothesis and significance level before calculating so the decision rule is clear.
See it
Key words
Say what each word means before you turn the card.
Hypothesis testing
Try answering aloud or in your head before turning the card.
Spearman’s rank correlation
Try answering aloud or in your head before turning the card.
Chi-square test
Try answering aloud or in your head before turning the card.
Statistical significance
Try answering aloud or in your head before turning the card.
See every definition
- Hypothesis testing
- Testing whether a sample pattern provides evidence against a null hypothesis, with the test and significance level chosen before interpreting results.
- Spearman’s rank correlation
- Measures the strength and direction of a monotonic association between paired ranked observations, entered with n, the number of valid pairs, to select the critical value.
- Chi-square test
- Compares observed and expected frequencies for categorical data, either for association in a contingency table or for a stated expected distribution, using degrees of freedom.
- Statistical significance
- A result is significant when the null hypothesis is rejected; otherwise there is insufficient evidence to reject it, and association does not by itself prove causation.
There is more to this lesson
The full lesson goes on to check your understanding and help you earn the marks. Create a free account to carry on, with your progress saved.
A week of Premium from your first lesson · Then the free plan continues · No card, no charge
Test your understanding of Statistical skills: Inferential and relational statistical techniques to include Spearman’s rank correlation and Chi-square test and the application of significance tests.
Active recall beats re-reading. Take an instant quiz now to test what you’ve learned and lock it into long-term memory.
A week of Premium from your first lesson · Then the free plan continues · No card, no charge