AQA · A-Level · Geography
Course version: 7037 · Version from Sept 2018
Statistical skills: Measures of central tendency – mean, mode, median.
Measures of central tendency summarise a dataset by identifying its central or typical value.
Checked against the AQA 7037 specification (opens in a new tab) on .
- Point 1 of 3
- 4 key terms
Study notes
From the checked teaching notes for this specification point.
The idea
Measures of central tendency summarise a dataset by identifying its central or typical value. The mean is the mathematical average, calculated by summing all values and dividing by the total number of observations. It uses all data but is easily skewed by extreme outliers. The median is the middle value when data is ordered sequentially; it is highly effective for skewed distributions, such as river discharge data during a flood event. The mode is the most frequently occurring value, useful for categorical data like dominant pebble lithology on a beach. Selecting the appropriate measure depends on the data type and the presence of anomalies, ensuring geographical analysis remains robust and representative of the true conditions.
What earns the marks
- Identify the correct measure of central tendency for a given geographical dataset.
- Calculate the mean by summing all values and dividing by the sample size.
- Determine the median by ordering data and finding the middle value, or the average of the two middle values if the sample size is even.
- Identify the mode as the most frequent value, recognising that datasets can be bimodal or have no mode.
- Evaluate the limitations of the mean when extreme outliers are present in the dataset.
Common mistakes and how to put them right
Failing to rank data in numerical order before finding the median.
Put it right: Sort the dataset from lowest to highest first.
Assuming the mean is always the best average.
Put it right: Use the median instead if the dataset contains extreme anomalies that would skew the result.
Confusing the mode with the majority.
Put it right: The mode is simply the most frequent value, even if it does not represent over half the dataset.
Exam tips
- Always show your working when calculating the mean, as method marks may be awarded even if the final answer is incorrect.
- When asked to justify a chosen measure, reference the presence or absence of extreme outliers in the provided data.
- Check if the question asks for the answer to a specific number of decimal places or significant figures.
Try the lesson
The start of the Statistical skills: Measures of central tendency – mean, mode, median. lesson, made from checked teaching notes for this specification point.
Have a go first
A geographer records the number of pebbles in seven different quadrats: 10, 12, 12, 14, 18, 20, 26. What is the mode of this dataset?
Listen
Measures of central tendency summarise a dataset by identifying its central or typical value. The mean is the mathematical average, calculated by summing all values and dividing by the total number of observations. It uses all data but is easily skewed by extreme outliers. The median is the middle value when data is ordered sequentially; it is highly effective for skewed distributions, such as river discharge data during a flood event. The mode is the most frequently occurring value, useful for categorical data like dominant pebble lithology on a beach. Selecting the appropriate measure depends on the data type and the presence of anomalies, ensuring geographical analysis remains robust and representative of the true conditions. A strong answer earns marks for these points. Identify the correct measure of central tendency for a given geographical dataset. Calculate the mean by summing all values and dividing by the sample size. Determine the median by ordering data and finding the middle value, or the average of the two middle values if the sample size is even. Identify the mode as the most frequent value, recognising that datasets can be bimodal or have no mode. Exam tip: Always show your working when calculating the mean, as method marks may be awarded even if the final answer is incorrect.
See it

Key words
Say what each word means before you turn the card.
Measures of central tendency
Try answering aloud or in your head before turning the card.
Mean
Try answering aloud or in your head before turning the card.
Median
Try answering aloud or in your head before turning the card.
Mode
Try answering aloud or in your head before turning the card.
See every definition
- Measures of central tendency
- Statistics that summarise a dataset by identifying its central or typical value, such as the mean, mode and median.
- Mean
- The mathematical average, calculated by summing all values and dividing by the total number of observations.
- Median
- The middle value when data is ordered sequentially, highly effective for skewed distributions.
- Mode
- The most frequently occurring value, useful for categorical data.
Label the diagram
Some boxes have lost their names. Pick the right name for each number.
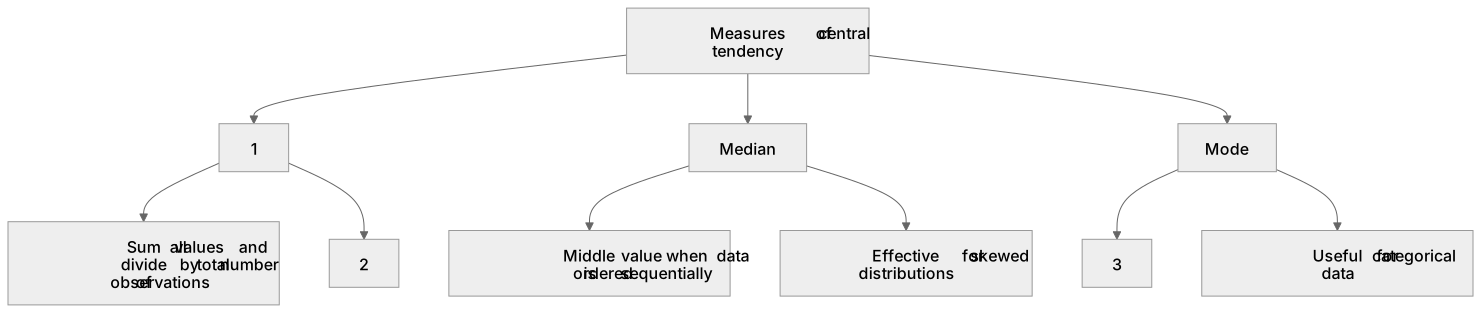
1Box 1
2Box 2
3Box 3
There is more to this lesson
The full lesson goes on to check your understanding and help you earn the marks. Create a free account to carry on, with your progress saved.
A week of Premium from your first lesson · Then the free plan continues · No card, no charge
Test your understanding of Statistical skills: Measures of central tendency – mean, mode, median.
Active recall beats re-reading. Take an instant quiz now to test what you’ve learned and lock it into long-term memory.
A week of Premium from your first lesson · Then the free plan continues · No card, no charge