AQA · A-Level · Geography
Course version: 7037 · Version from Sept 2018
The water cycle: Runoff variation and the flood hydrograph.
A flood hydrograph illustrates how a river's discharge, measured in m³ s⁻¹, responds to a specific rainfall event over time.
Checked against the AQA 7037 specification (opens in a new tab) on .
- Point 4 of 5
- 4 key terms
Study notes
From the checked teaching notes for this specification point.
The idea
A flood hydrograph illustrates how a river's discharge, measured in m³ s⁻¹, responds to a specific rainfall event over time. It plots both rainfall (as a bar chart) and discharge (as a line graph). Runoff variation is determined by the balance between precipitation and infiltration. A 'flashy' hydrograph features a steep rising limb, high peak discharge, and a short lag time, often resulting from impermeable surfaces or intense rainfall exceeding infiltration capacity. Conversely, a subdued hydrograph has a longer lag time and lower peak, typical of forested catchments where interception and infiltration reduce rapid surface runoff. Understanding these variations is crucial for predicting flood risks and managing drainage basins effectively.
What earns the marks
- Define lag time as the time difference between peak rainfall and peak discharge.
- Explain how physical factors, such as steep relief or impermeable geology, increase surface runoff and create flashy hydrographs.
- Describe the key components of a hydrograph: rising limb, peak discharge, falling (recession) limb, and baseflow.
- Analyse how antecedent moisture conditions affect infiltration rates and subsequent runoff variation.
Common mistakes and how to put them right
Confusing the rising limb with peak discharge.
Put it right: The rising limb shows the rate of increase, whereas peak discharge is the maximum volume of water passing a point.
Assuming baseflow is surface runoff.
Put it right: Baseflow is actually the normal day-to-day discharge provided by groundwater seepage, not rapid overland flow.
Stating that lag time is the duration of the storm.
Put it right: Lag time is the delay between peak rainfall and peak discharge, not the storm's length.
Exam tips
- Always use specific hydrograph terminology, such as rising limb, lag time, and baseflow, when describing river responses to rainfall.
- When comparing two hydrographs, explicitly link the differences in their shapes to specific basin characteristics like geology or land use.
- Remember to state the units for discharge as m³ s⁻¹ (cumecs) when referencing data from a provided hydrograph.
Try the lesson
The start of the The water cycle: Runoff variation and the flood hydrograph. lesson, made from checked teaching notes for this specification point.
Have a go first
Which component of a flood hydrograph represents the time difference between peak rainfall and peak discharge?
Listen
A flood hydrograph illustrates how a river's discharge, measured in m³ s⁻¹, responds to a specific rainfall event over time. It plots both rainfall (as a bar chart) and discharge (as a line graph). Runoff variation is determined by the balance between precipitation and infiltration. A 'flashy' hydrograph features a steep rising limb, high peak discharge, and a short lag time, often resulting from impermeable surfaces or intense rainfall exceeding infiltration capacity. Conversely, a subdued hydrograph has a longer lag time and lower peak, typical of forested catchments where interception and infiltration reduce rapid surface runoff. Understanding these variations is crucial for predicting flood risks and managing drainage basins effectively. A strong answer earns marks for these points. Define lag time as the time difference between peak rainfall and peak discharge. Explain how physical factors, such as steep relief or impermeable geology, increase surface runoff and create flashy hydrographs. Describe the key components of a hydrograph: rising limb, peak discharge, falling (recession) limb, and baseflow. Analyse how antecedent moisture conditions affect infiltration rates and subsequent runoff variation. Exam tip: Always use specific hydrograph terminology, such as rising limb, lag time, and baseflow, when describing river responses to rainfall.
See it
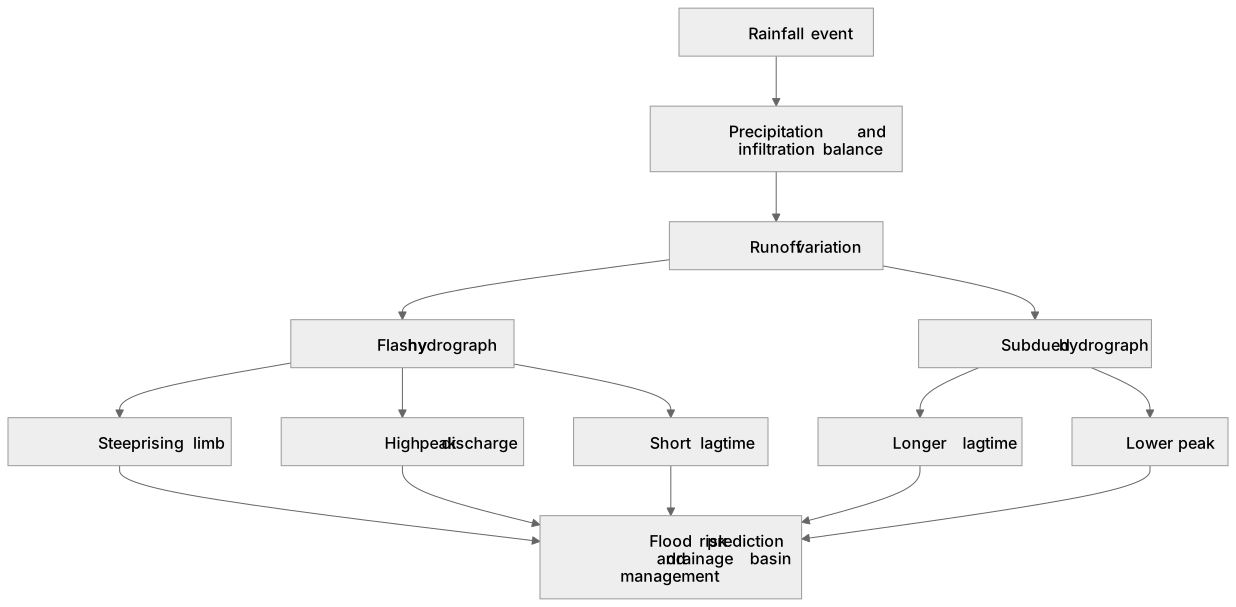
Key words
Say what each word means before you turn the card.
Flood hydrograph
Try answering aloud or in your head before turning the card.
Lag time
Try answering aloud or in your head before turning the card.
Flashy hydrograph
Try answering aloud or in your head before turning the card.
Subdued hydrograph
Try answering aloud or in your head before turning the card.
See every definition
- Flood hydrograph
- A graph illustrating how a river's discharge, measured in m³ s⁻¹, responds to a specific rainfall event over time, plotting rainfall as a bar chart and discharge as a line graph.
- Lag time
- The delay between peak rainfall and peak discharge, which is short in a flashy hydrograph and longer in a subdued one.
- Flashy hydrograph
- A hydrograph with a steep rising limb, high peak discharge and a short lag time, often resulting from impermeable surfaces or intense rainfall exceeding infiltration capacity.
- Subdued hydrograph
- A hydrograph with a longer lag time and lower peak, typical of forested catchments where interception and infiltration reduce rapid surface runoff.
Label the diagram
Some boxes have lost their names. Pick the right name for each number.
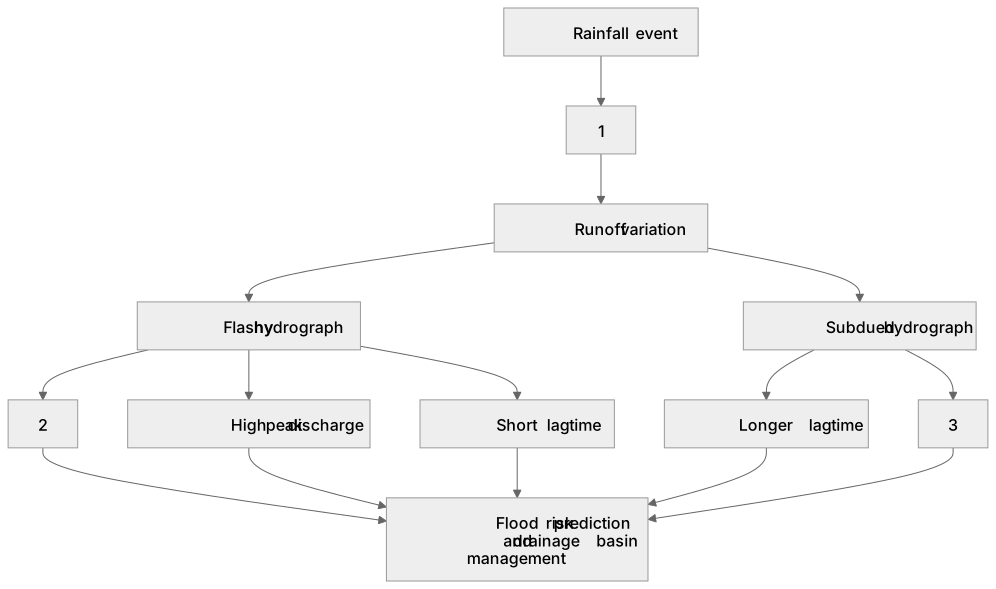
1Box 1
2Box 2
3Box 3
There is more to this lesson
The full lesson goes on to check your understanding and help you earn the marks. Create a free account to carry on, with your progress saved.
A week of Premium from your first lesson · Then the free plan continues · No card, no charge
Test your understanding of The water cycle: Runoff variation and the flood hydrograph.
Active recall beats re-reading. Take an instant quiz now to test what you’ve learned and lock it into long-term memory.
A week of Premium from your first lesson · Then the free plan continues · No card, no charge