AQA · GCSE · Geography
Geographical skills
Master the essential numerical and geographical skills required for GCSE Geography. This guide covers everything from data collection and statistical analysis to interpreting complex maps and graphs, ensuring you're fully prepared for the skills assessed across all exam papers.
- 4 min read
- 3 worked examples
- 5 practice questions
- 6 key terms
Study Notes
Overview
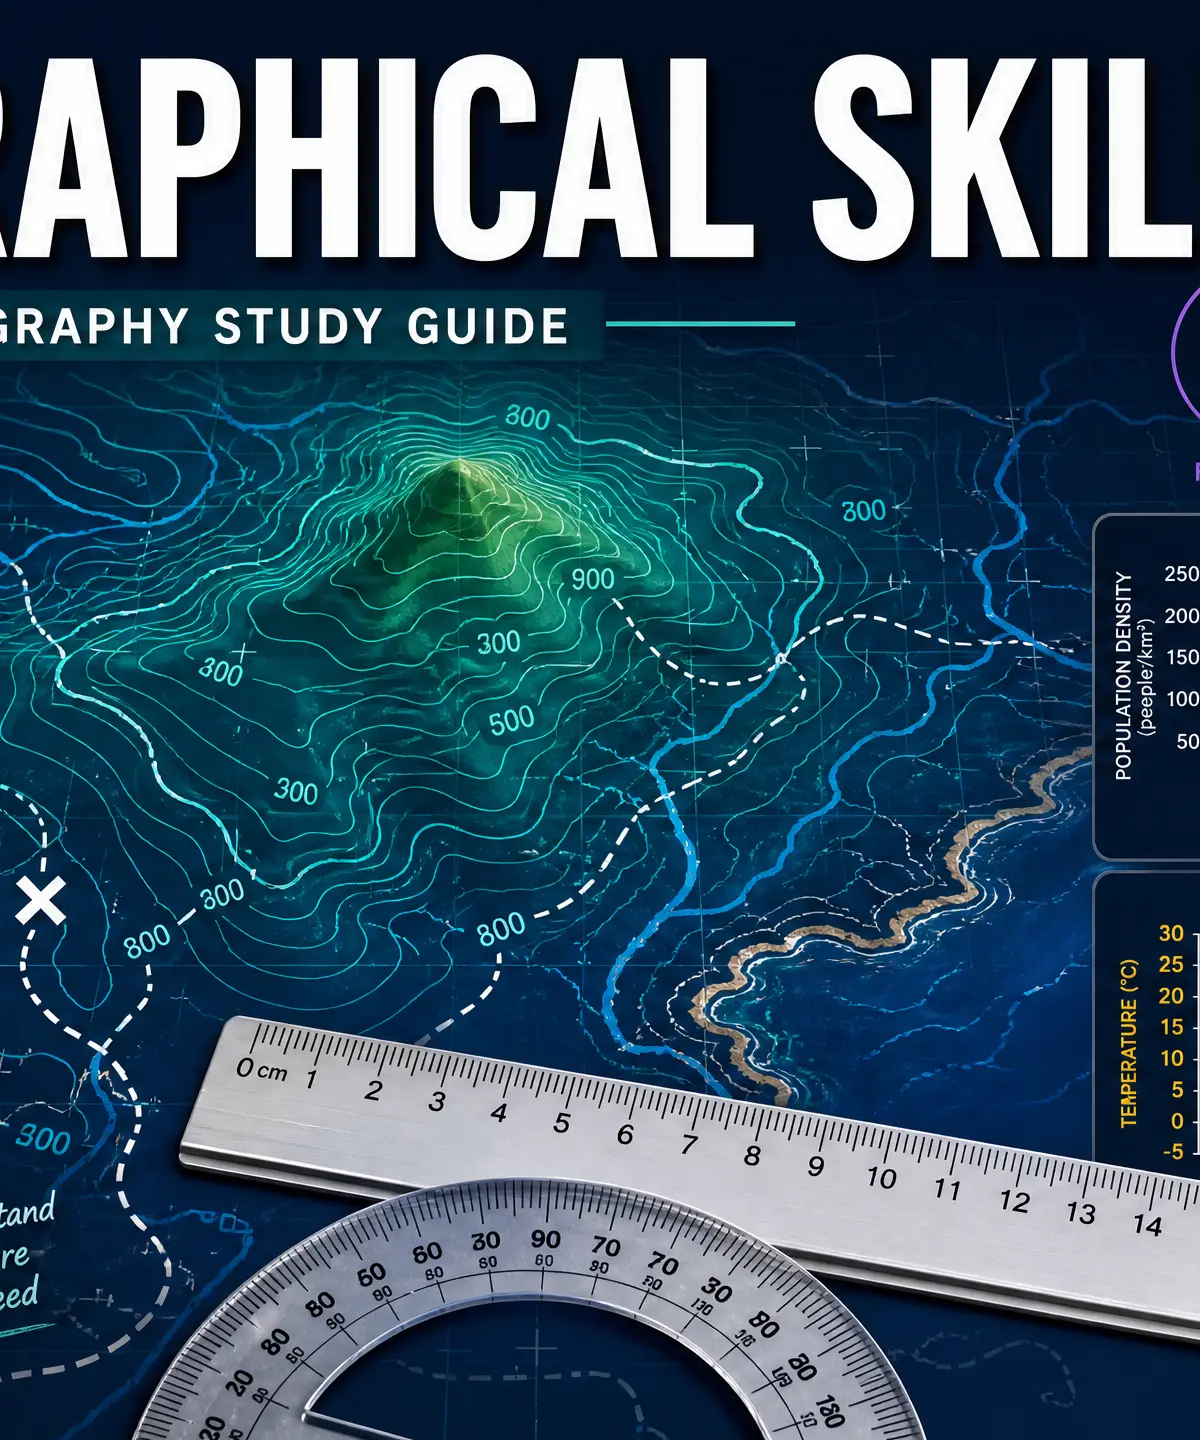
Geographical skills, particularly numerical and statistical skills, are the foundation of geographical enquiry. Examiners test these skills across all three GCSE Geography papers, meaning they account for a significant proportion of your final grade. You are expected to demonstrate an understanding of number, area, and scale, design robust fieldwork data collection sheets, and understand the crucial concepts of accuracy, reliability, and sample size. Furthermore, you must be able to confidently interpret quantitative relationships, use proportion and ratio, and draw informed conclusions from a variety of data sources. This guide provides the tools, formulas, and strategies needed to secure maximum marks in these crucial areas.
Core Numerical Skills
Number, Area and Scale
Key Concepts:
- Understanding large and small numbers in context (e.g., population figures, river discharge).
- Using scale to calculate real-world distances from maps.
- Calculating area (e.g., converting cm² on a map to km² in reality).
Examiner Expectation: Candidates must show their working. Even if the final calculation is incorrect, method marks are frequently awarded for demonstrating the correct approach.
Quantitative Relationships
Key Concepts:
- Converting between units (e.g., mm to cm, m to km).
- Understanding derived units like population density (people per km²).
Examiner Expectation: Always state the correct units in your final answer. A number without a unit is often considered meaningless in geographical contexts.
Proportion, Ratio, and Percentage
Key Concepts:
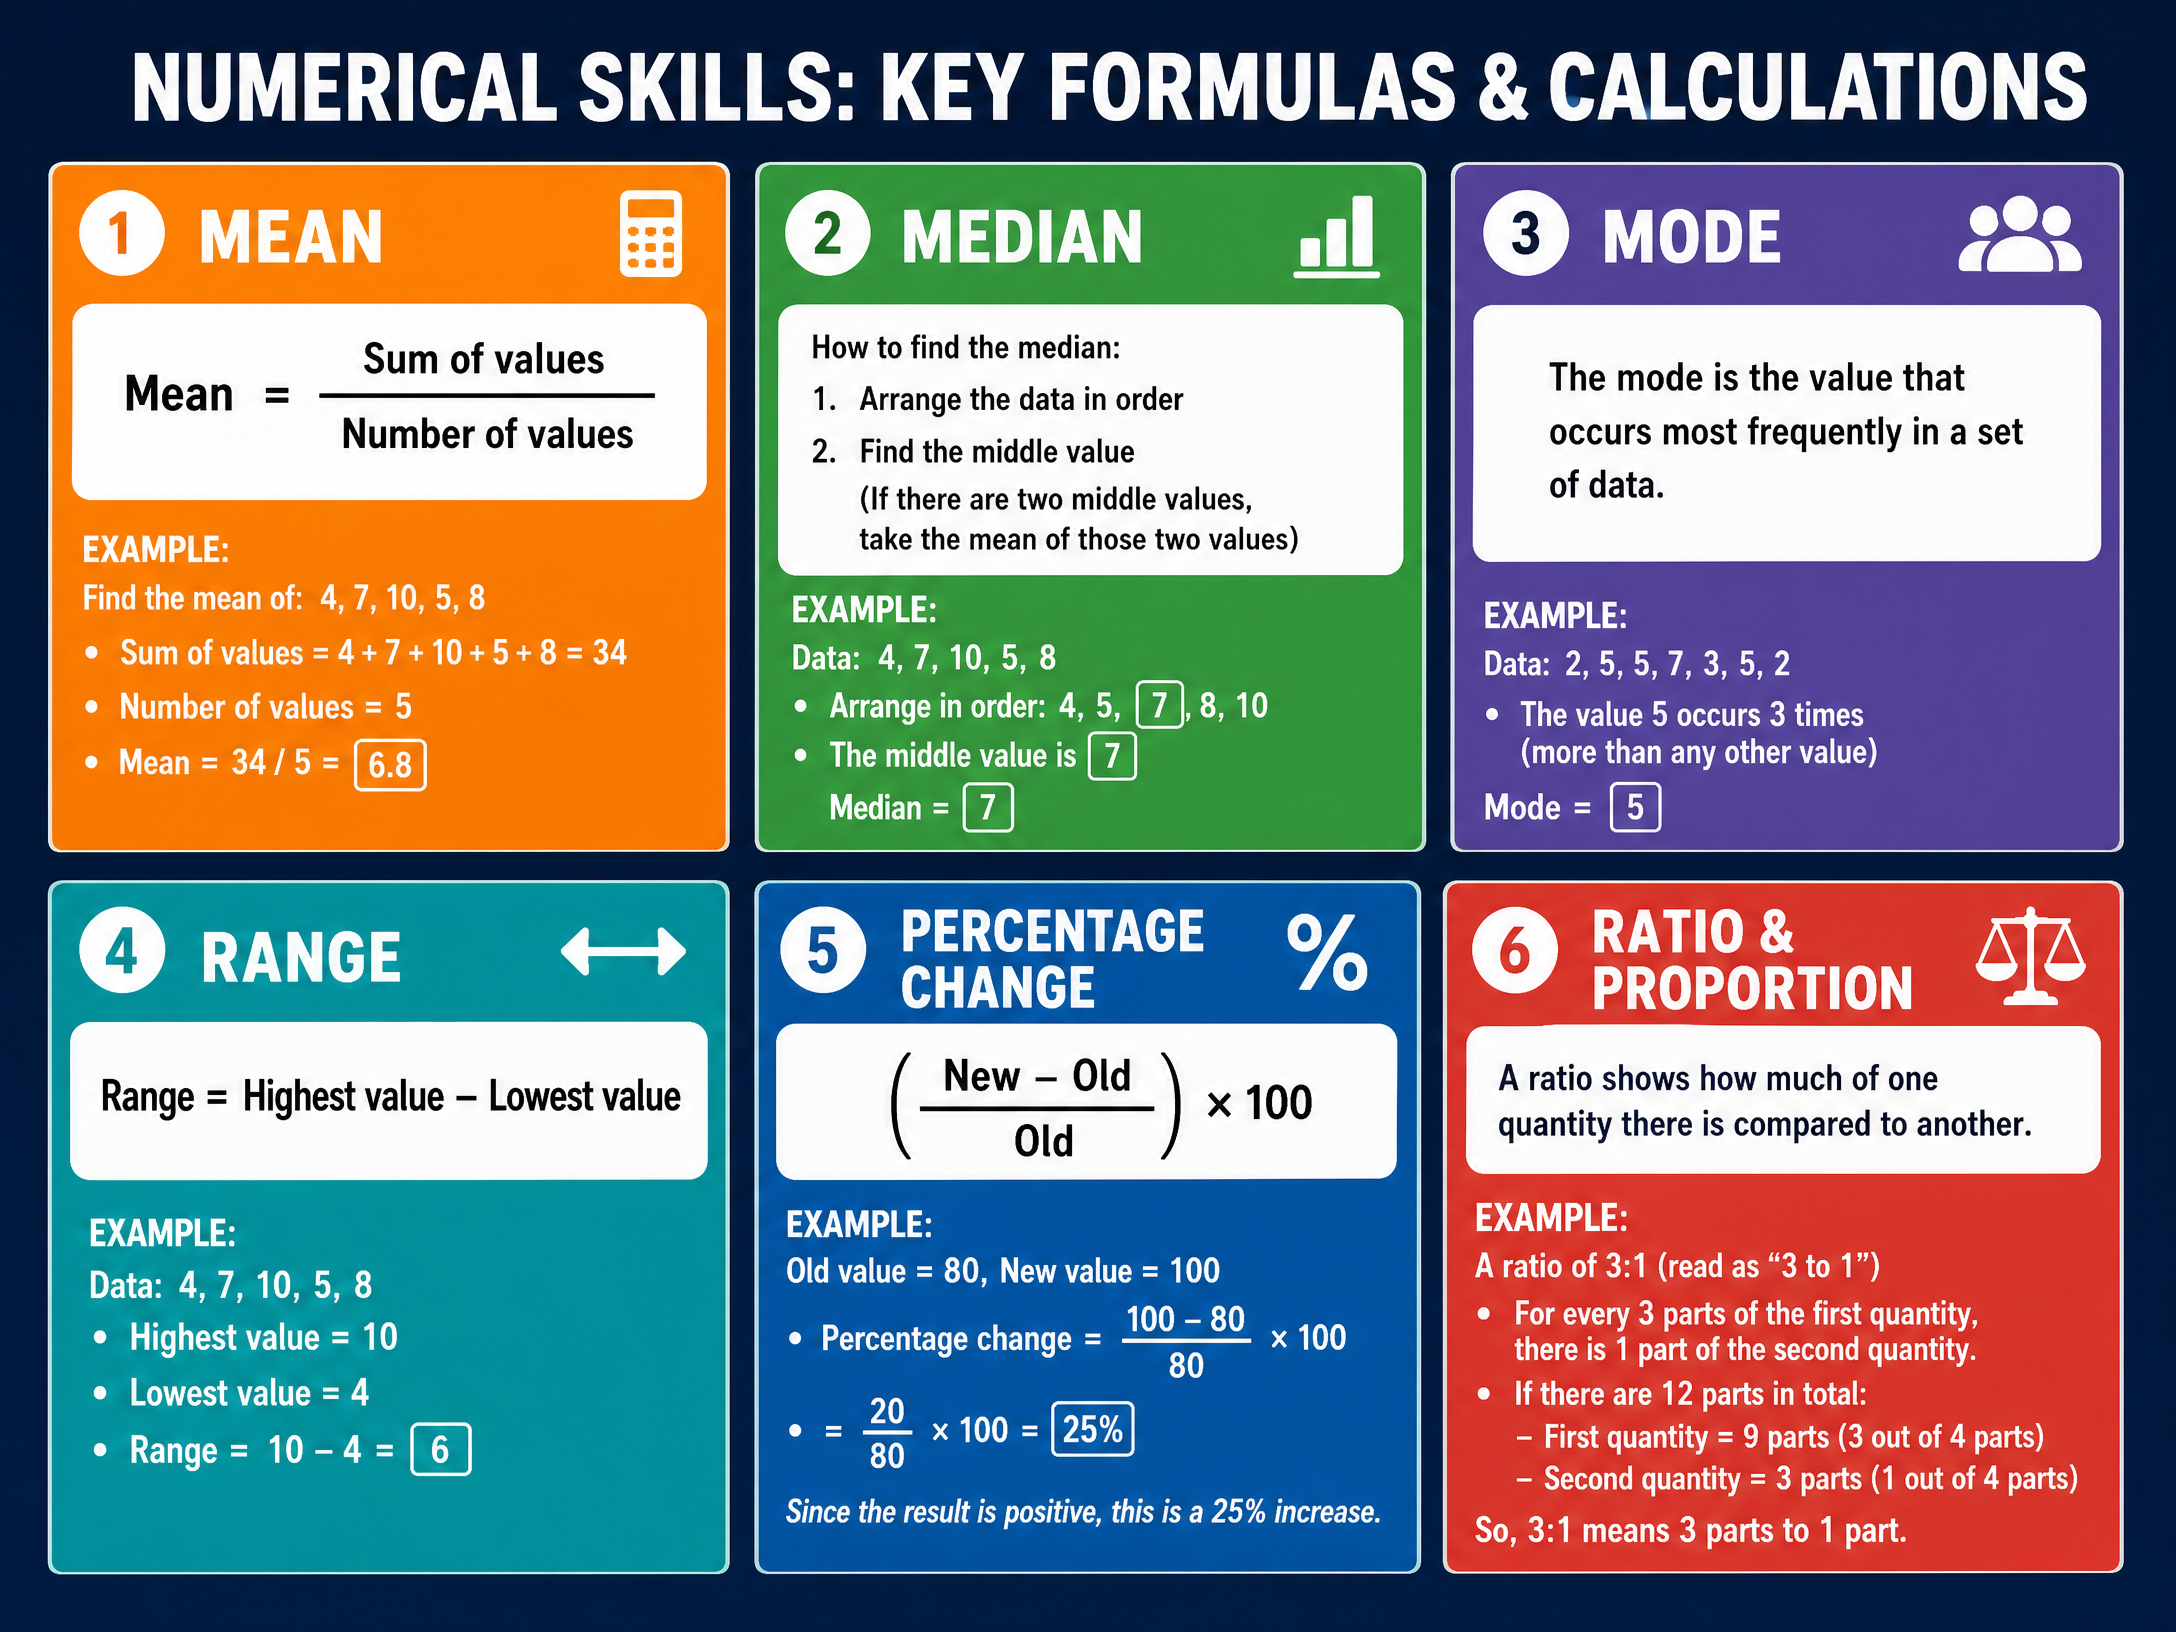
- Ratio: Comparing two quantities (e.g., 3:1).
- Proportion: Expressing a part of a whole (e.g., 1/4 or 25%).
- Percentage Change: Calculating the increase or decrease between two values.
Specific Formula: Percentage Change = ((New Value - Old Value) / Old Value) × 100
Fieldwork and Data Collection
Designing Data Collection Sheets
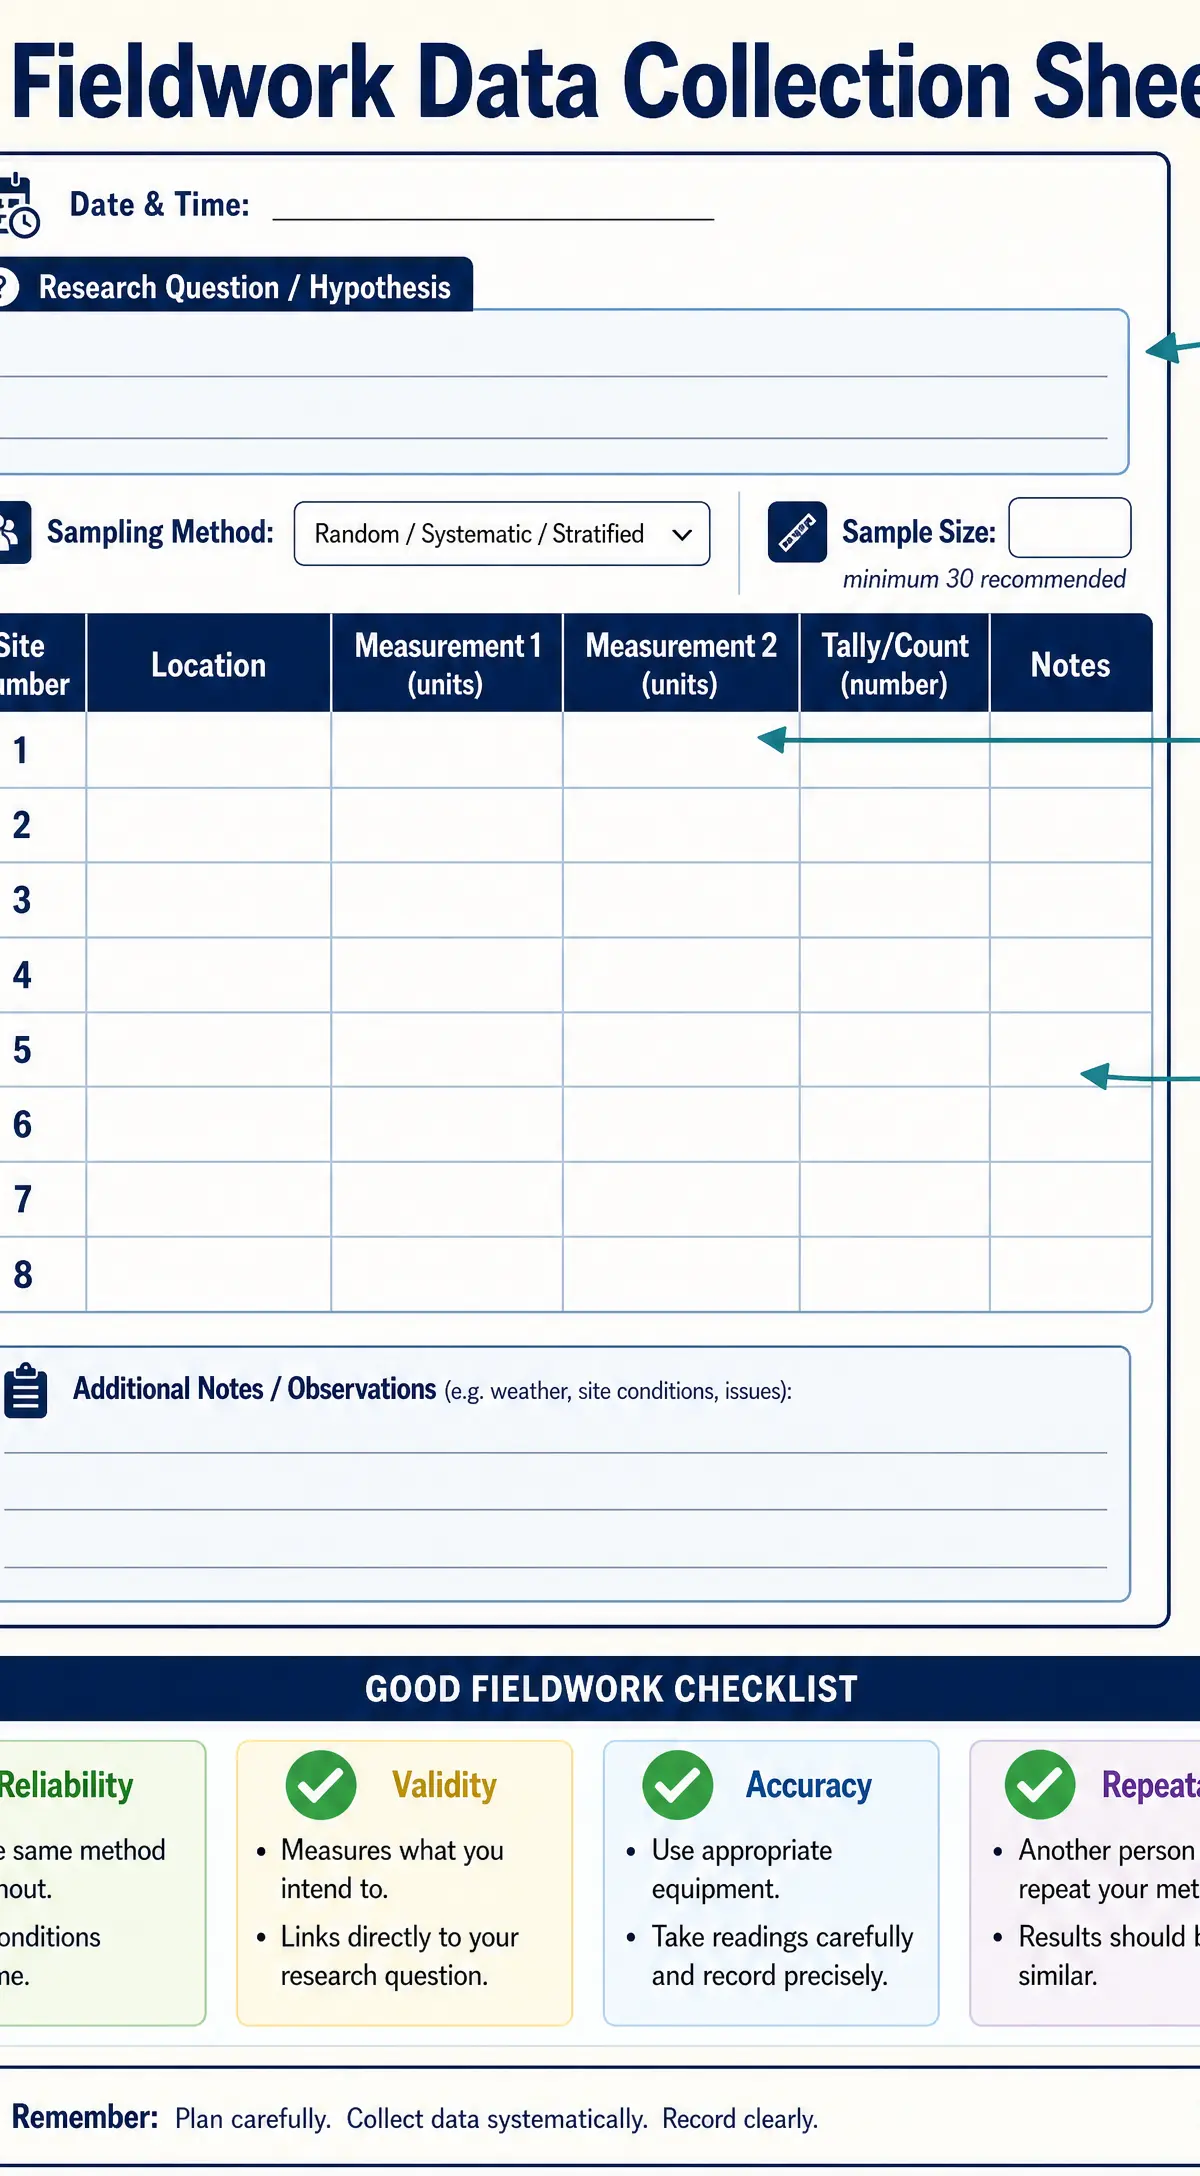
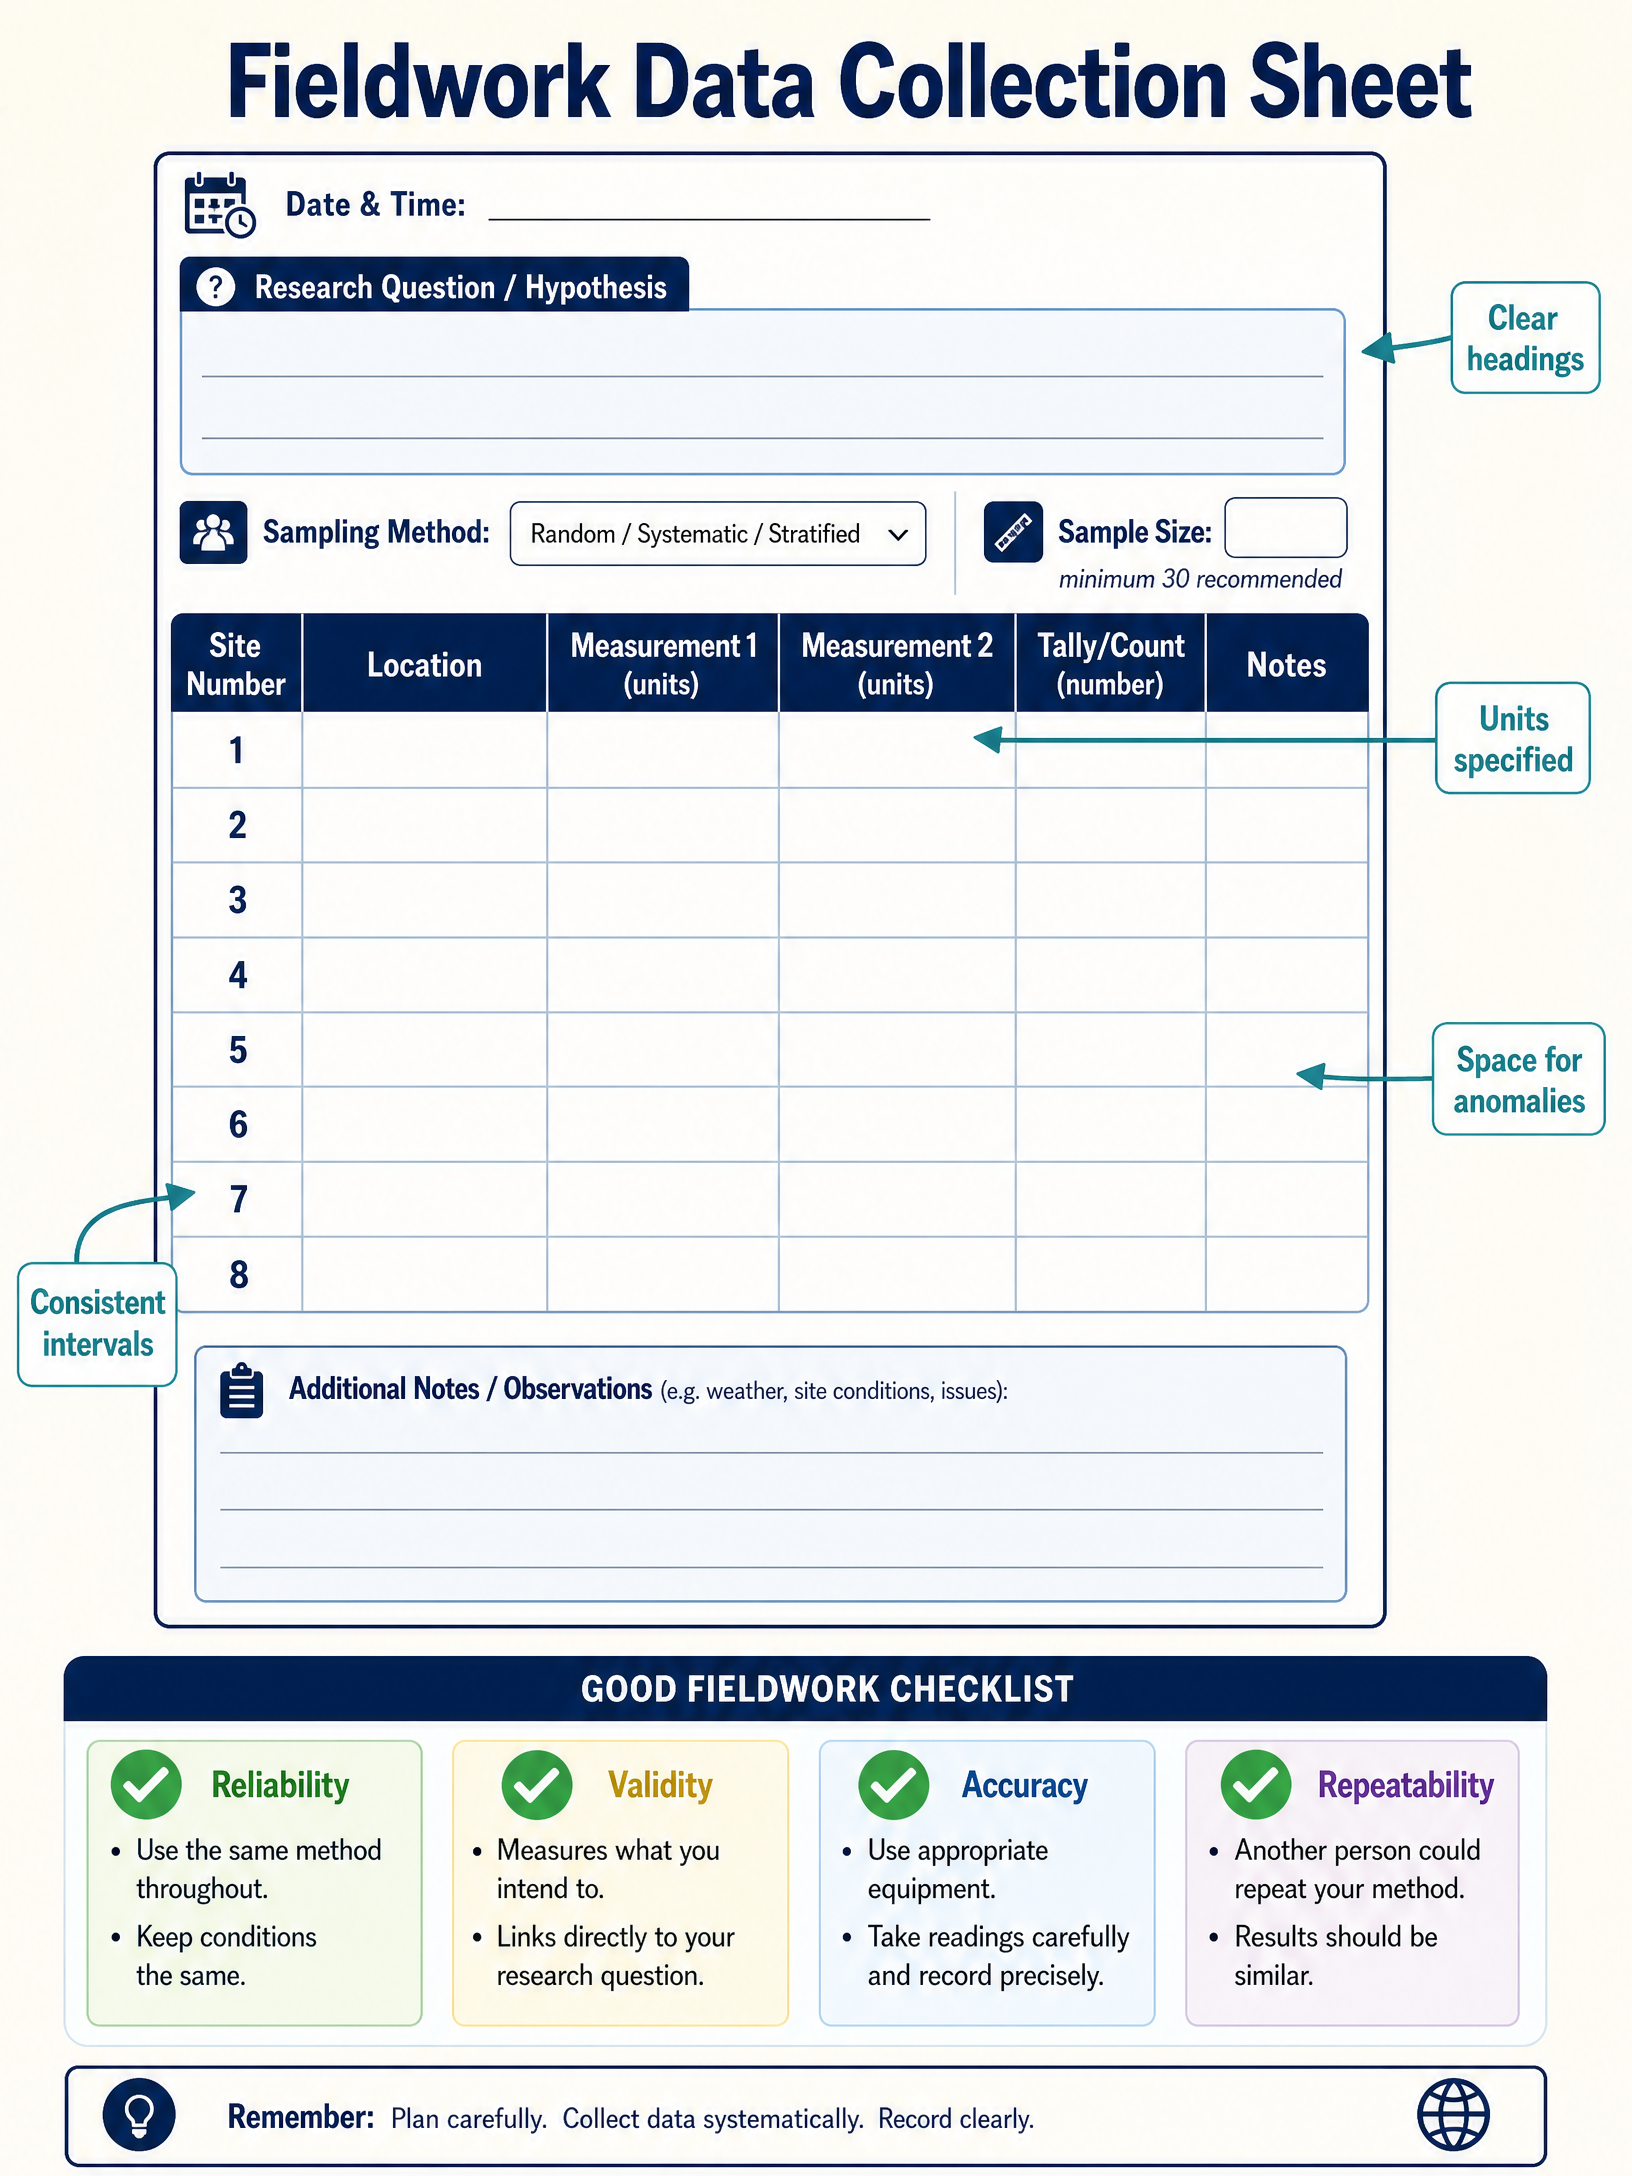
Key Features: A robust data collection sheet must have clear headings, specified units, sufficient rows for the sample size, and space to record anomalies or contextual notes (e.g., weather conditions).
Examiner Expectation: Candidates must design sheets that ensure data collection is systematic and repeatable by others, which guarantees reliability.
Sampling and Reliability
Key Concepts:
- Sample Size: A minimum of 30 is generally required for statistical reliability.
- Sampling Methods: Random (avoids bias), Systematic (regular intervals), Stratified (proportional representation of subgroups).
- Accuracy: Using appropriate, calibrated equipment and taking repeat readings.
Data Presentation and Interpretation
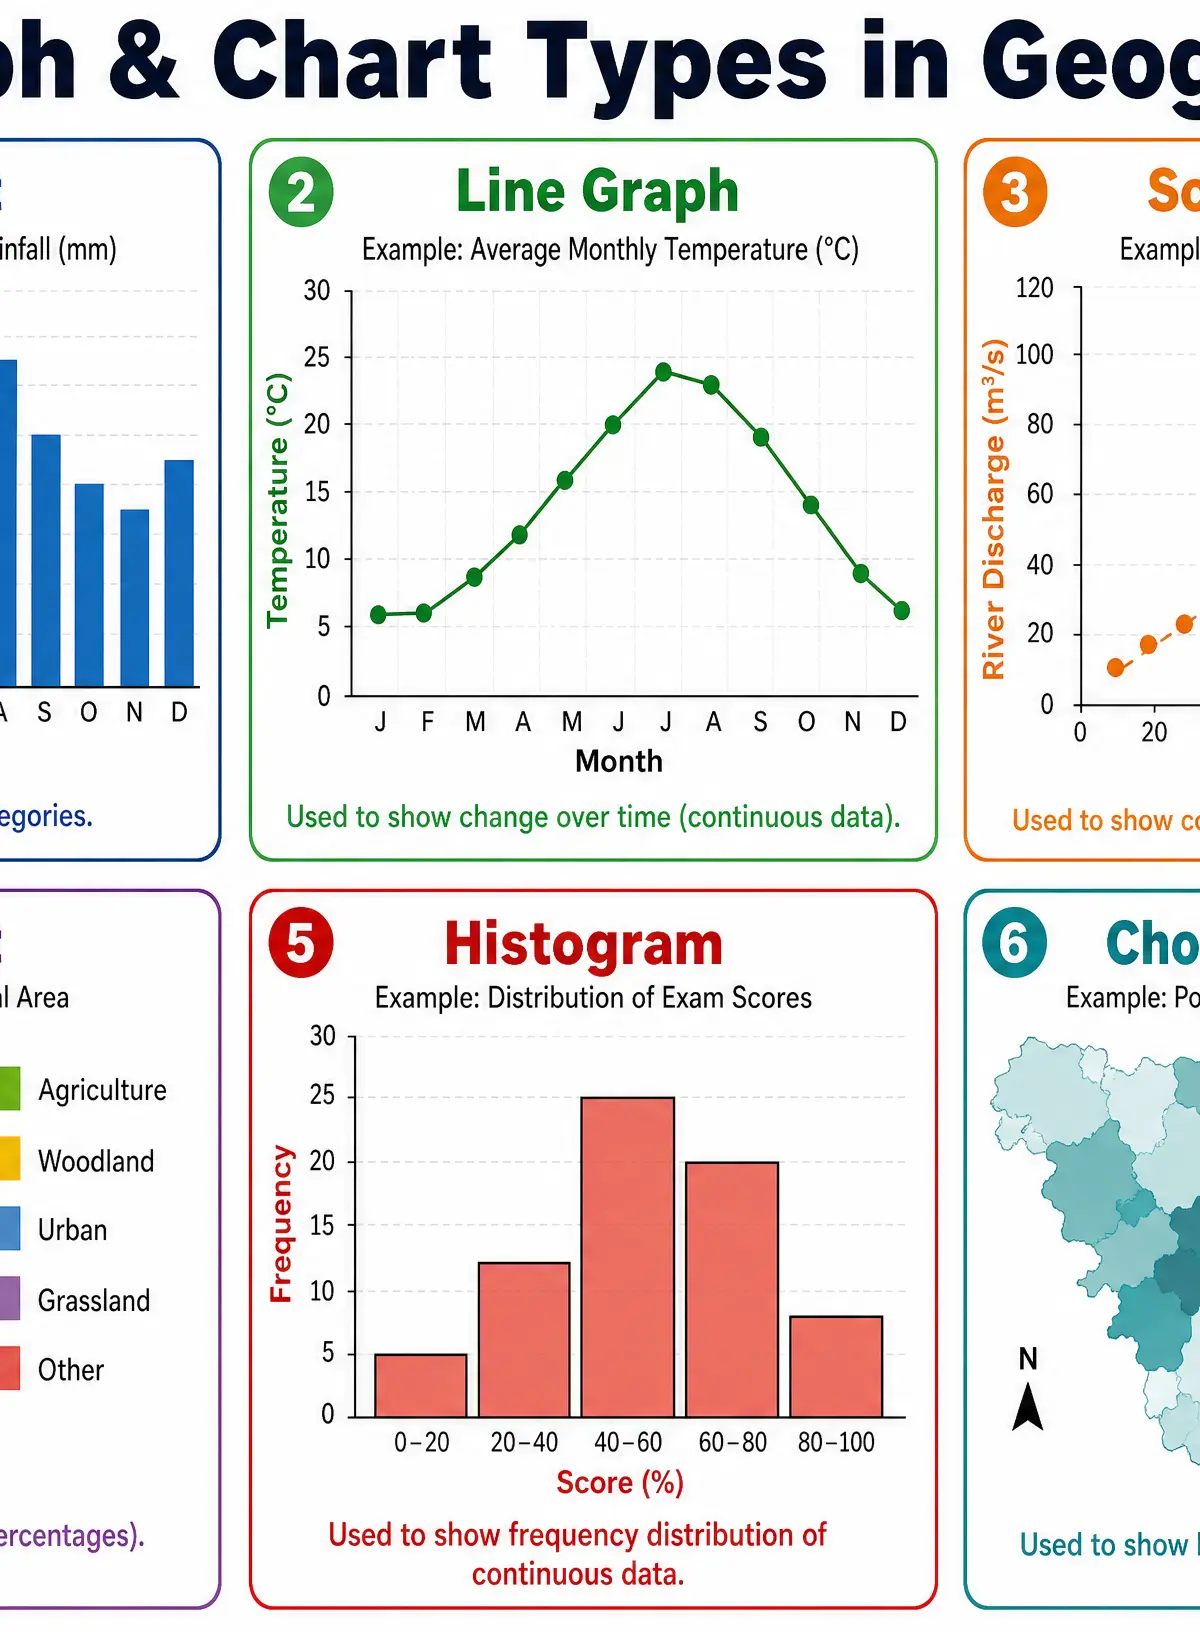
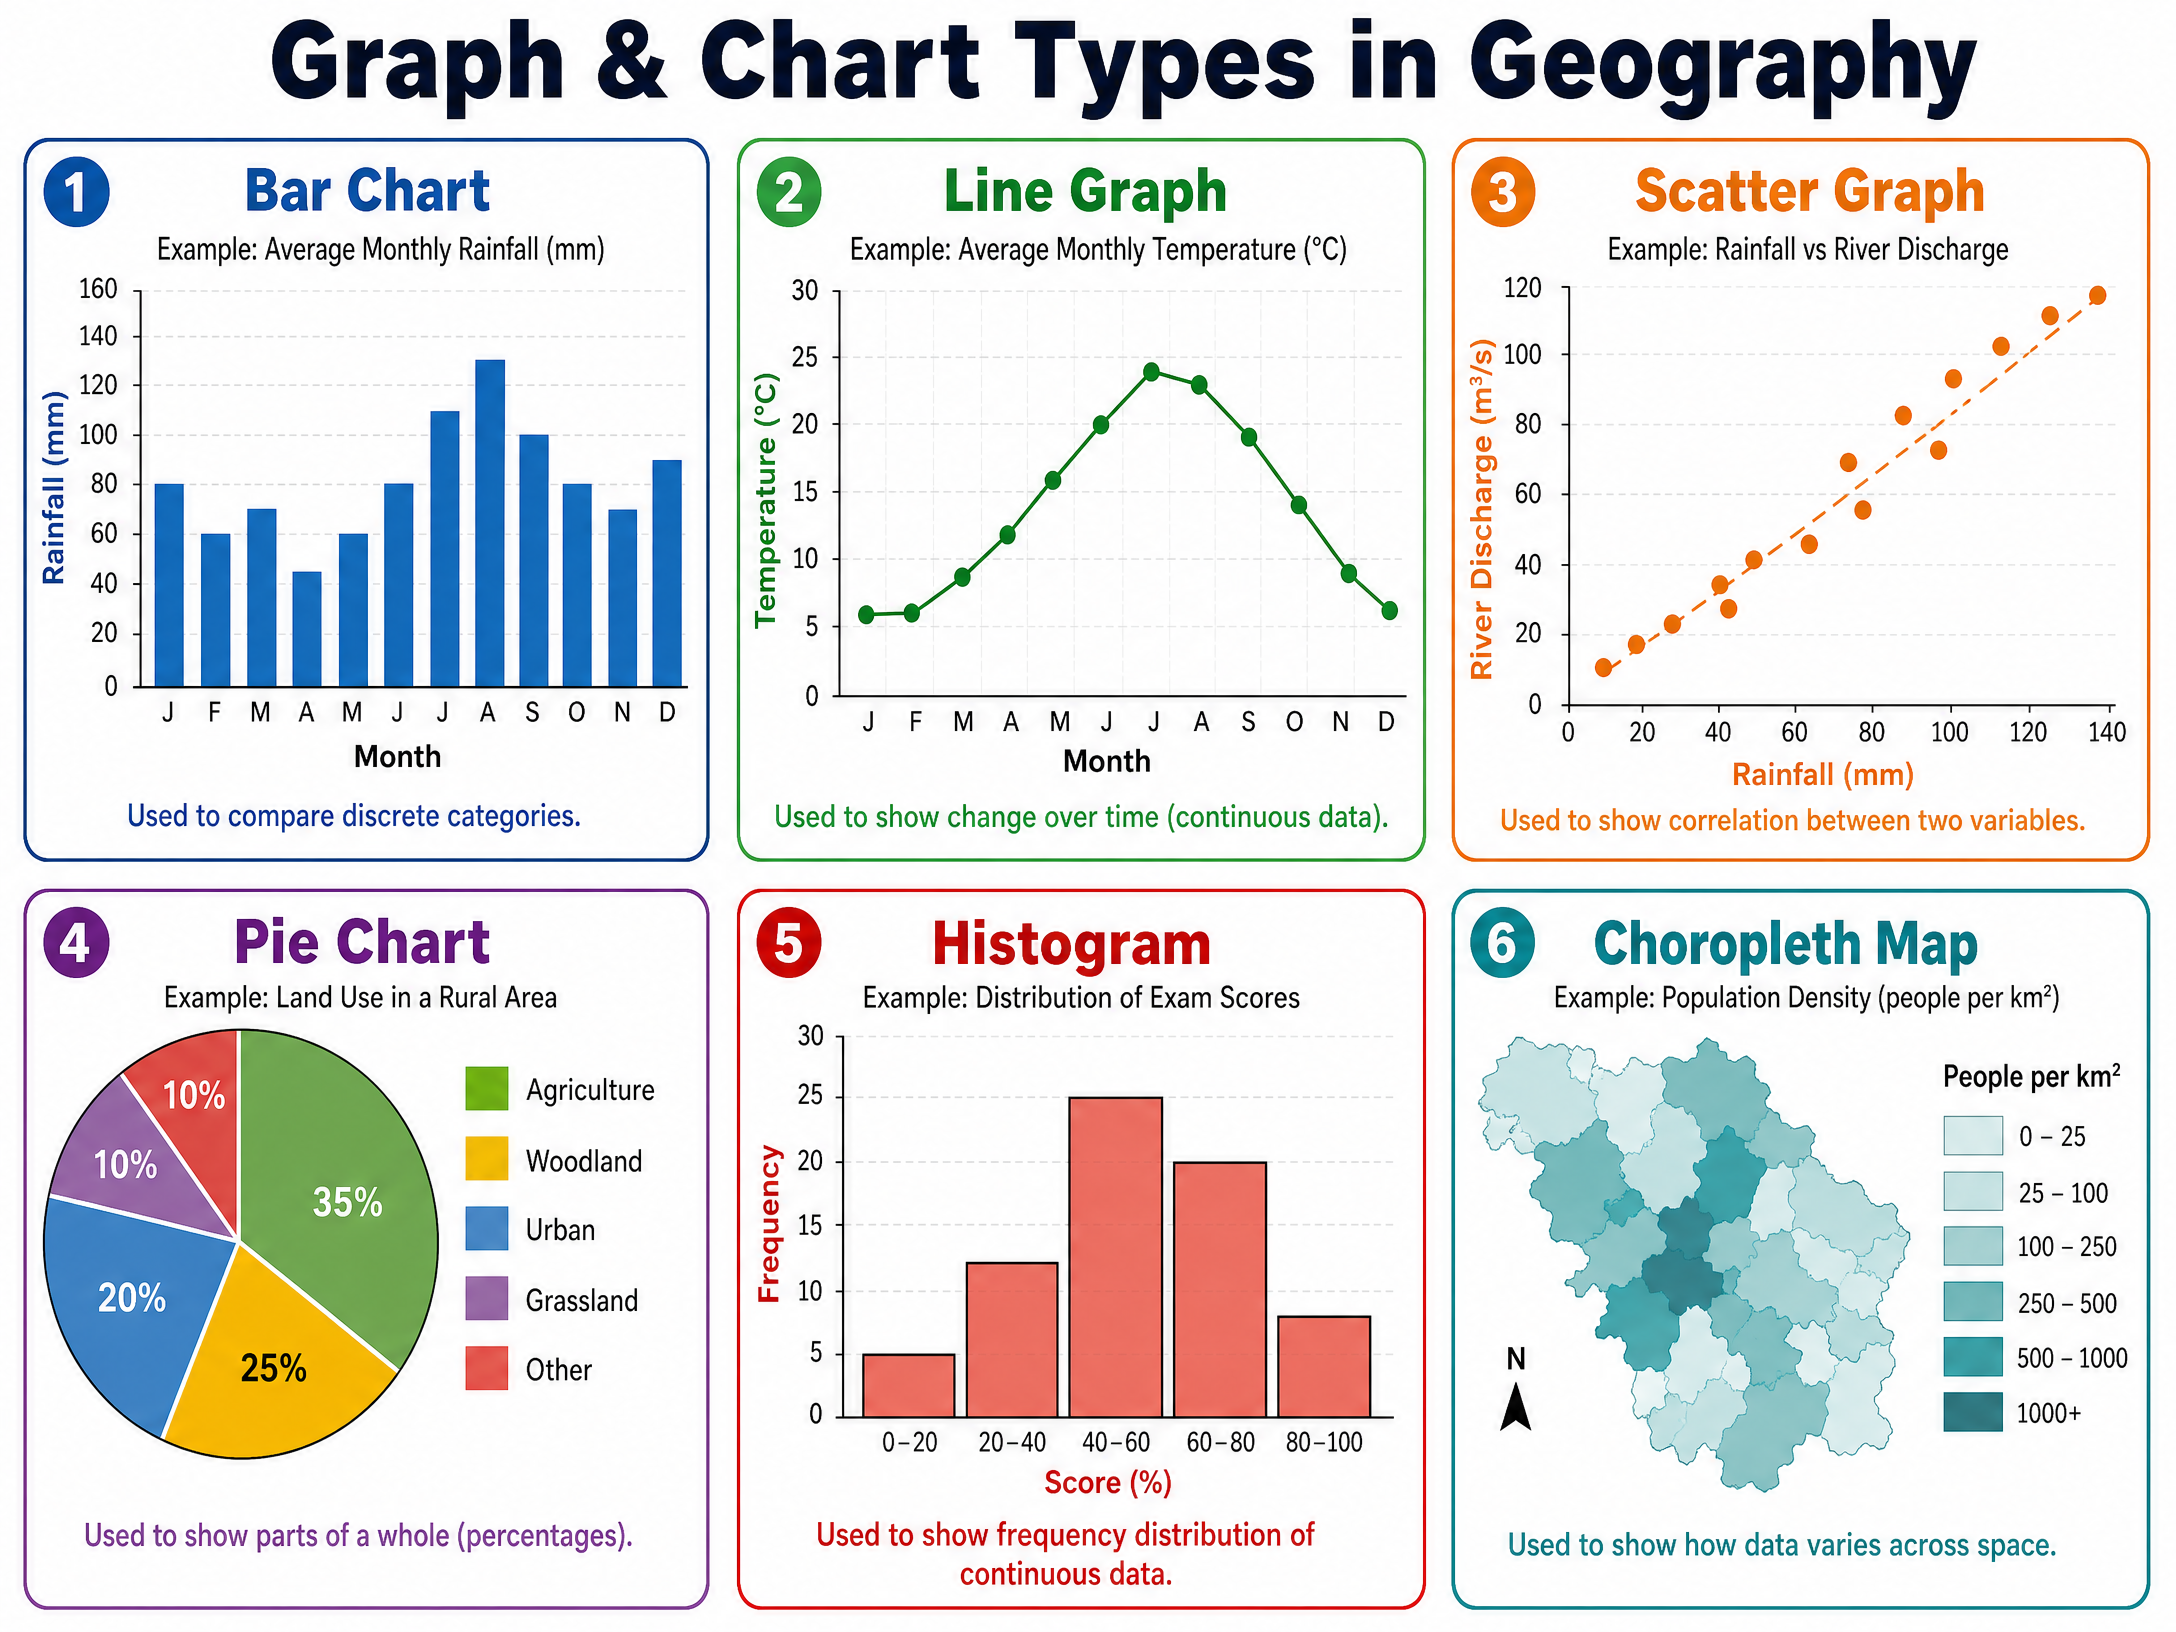
Interpreting Graphs and Maps
Key Skills:
- Reading values accurately from axes.
- Identifying trends, correlations, and anomalies.
- Drawing conclusions supported by specific data points.
Examiner Expectation: When asked to describe a pattern or draw a conclusion, candidates MUST quote specific figures from the resource provided. Vague statements like "it goes up" will not gain credit; instead use "it increases by 15mm between May and June."
Audio Revision
Listen to our comprehensive 10-minute podcast covering all these essential skills, complete with exam tips and a quick-fire recall quiz.

Worked Examples
3 worked examples — open one to explore the question and available guidance.
Practice Questions
Test your understanding — click to reveal model answers
A student conducted a pedestrian count in a town centre. They counted 45 people in 5 minutes at Site A, and 120 people in 5 minutes at Site B. Calculate the ratio of pedestrians at Site A to Site B in its simplest form. (2 marks)
Hint: Write the numbers as a ratio A:B, then find the highest common factor to divide both sides by.
Explain two ways a student could ensure their environmental quality survey data is reliable. (4 marks)
Hint: Think about sample size, who is doing the survey, and when it is being done.
Study the scatter graph provided. Describe the relationship shown between GDP per capita and life expectancy. (3 marks)
Hint: State the correlation type, describe what that means in words, and quote a specific data point as an example or identify an anomaly.
A river's cross-sectional area is 4.5m² and its average velocity is 0.8m/s. Calculate the river discharge. Show your working. (2 marks)
Hint: Discharge = Cross-sectional Area × Velocity.
Evaluate the use of a choropleth map to show population density across a country. (6 marks)
Hint: Discuss what a choropleth map does well (visual impact) and its main flaw (assumes even distribution within regions).