Subject: Mathematics | Level: A-Level | Exam Board: OCR
This guide provides a comprehensive overview of Probability for OCR A-Level Mathematics, focusing on the core concepts of set notation, conditional probability, and independence. It is designed to help students master the exam techniques required to secure top marks by breaking down complex ideas into manageable steps and providing extensive practice.
Revision Notes & Key Concepts
Worked Examples
Worked Example
Question: The events A and B are such that P(A) = 0.4, P(B) = 0.5 and P(A ∪ B) = 0.68. Show that the events A and B are not independent.
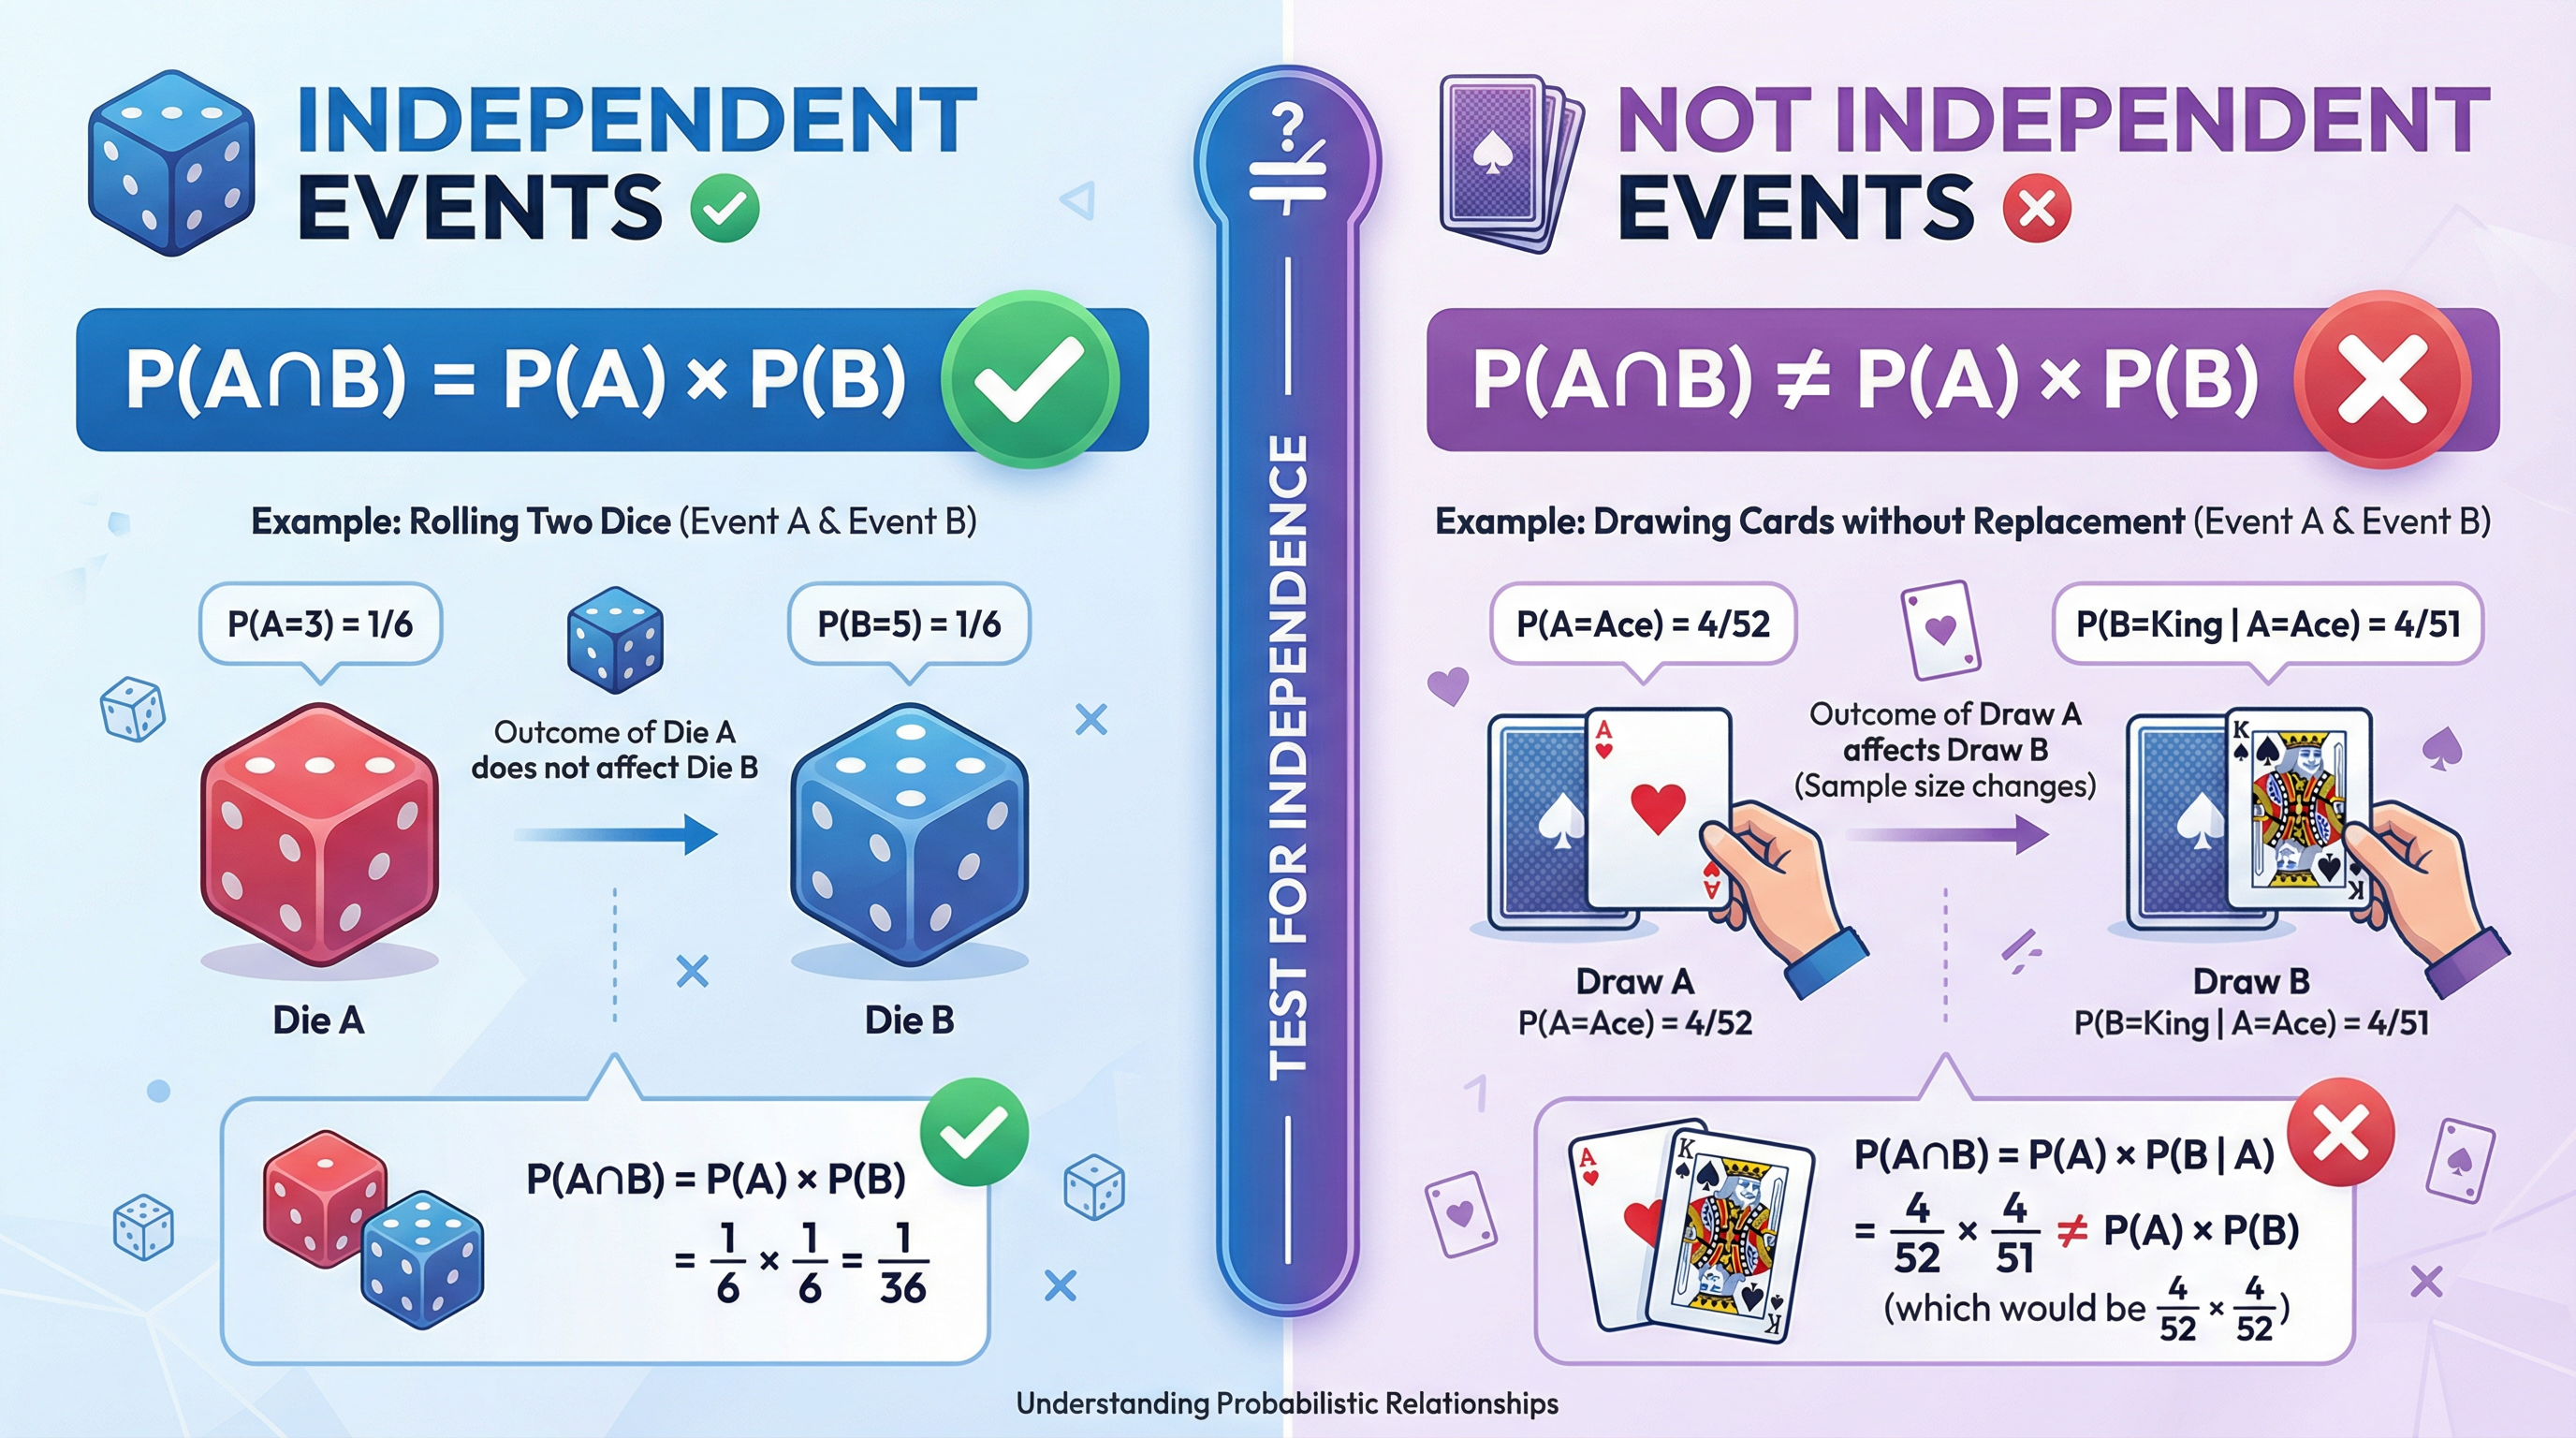
Solution: Step 1: State the addition formula to find the intersection. P(A ∪ B) = P(A) + P(B) - P(A ∩ B). This earns an M1 mark. Step 2: Substitute the given values into the formula. 0.68 = 0.4 + 0.5 - P(A ∩ B). Step 3: Rearrange to solve for P(A ∩ B). P(A ∩ B) = 0.4 + 0.5 - 0.68 = 0.22. This earns an A1 mark. Step 4: State the test for independence. For A and B to be independent, P(A ∩ B) must equal P(A) × P(B). Step 5: Calculate P(A) × P(B). 0.4 × 0.5 = 0.20. This earns an M1 mark. Step 6: Compare the two values and conclude. 0.22 ≠ 0.20, so P(A ∩ B) ≠ P(A) × P(B). Therefore, the events A and B are not independent. This concluding statement earns the final A1 mark.
Worked Example
Question: A bag contains 3 red balls and 5 blue balls. A ball is drawn at random, its colour is noted, and it is not replaced. A second ball is then drawn. Find the probability that the second ball is red.
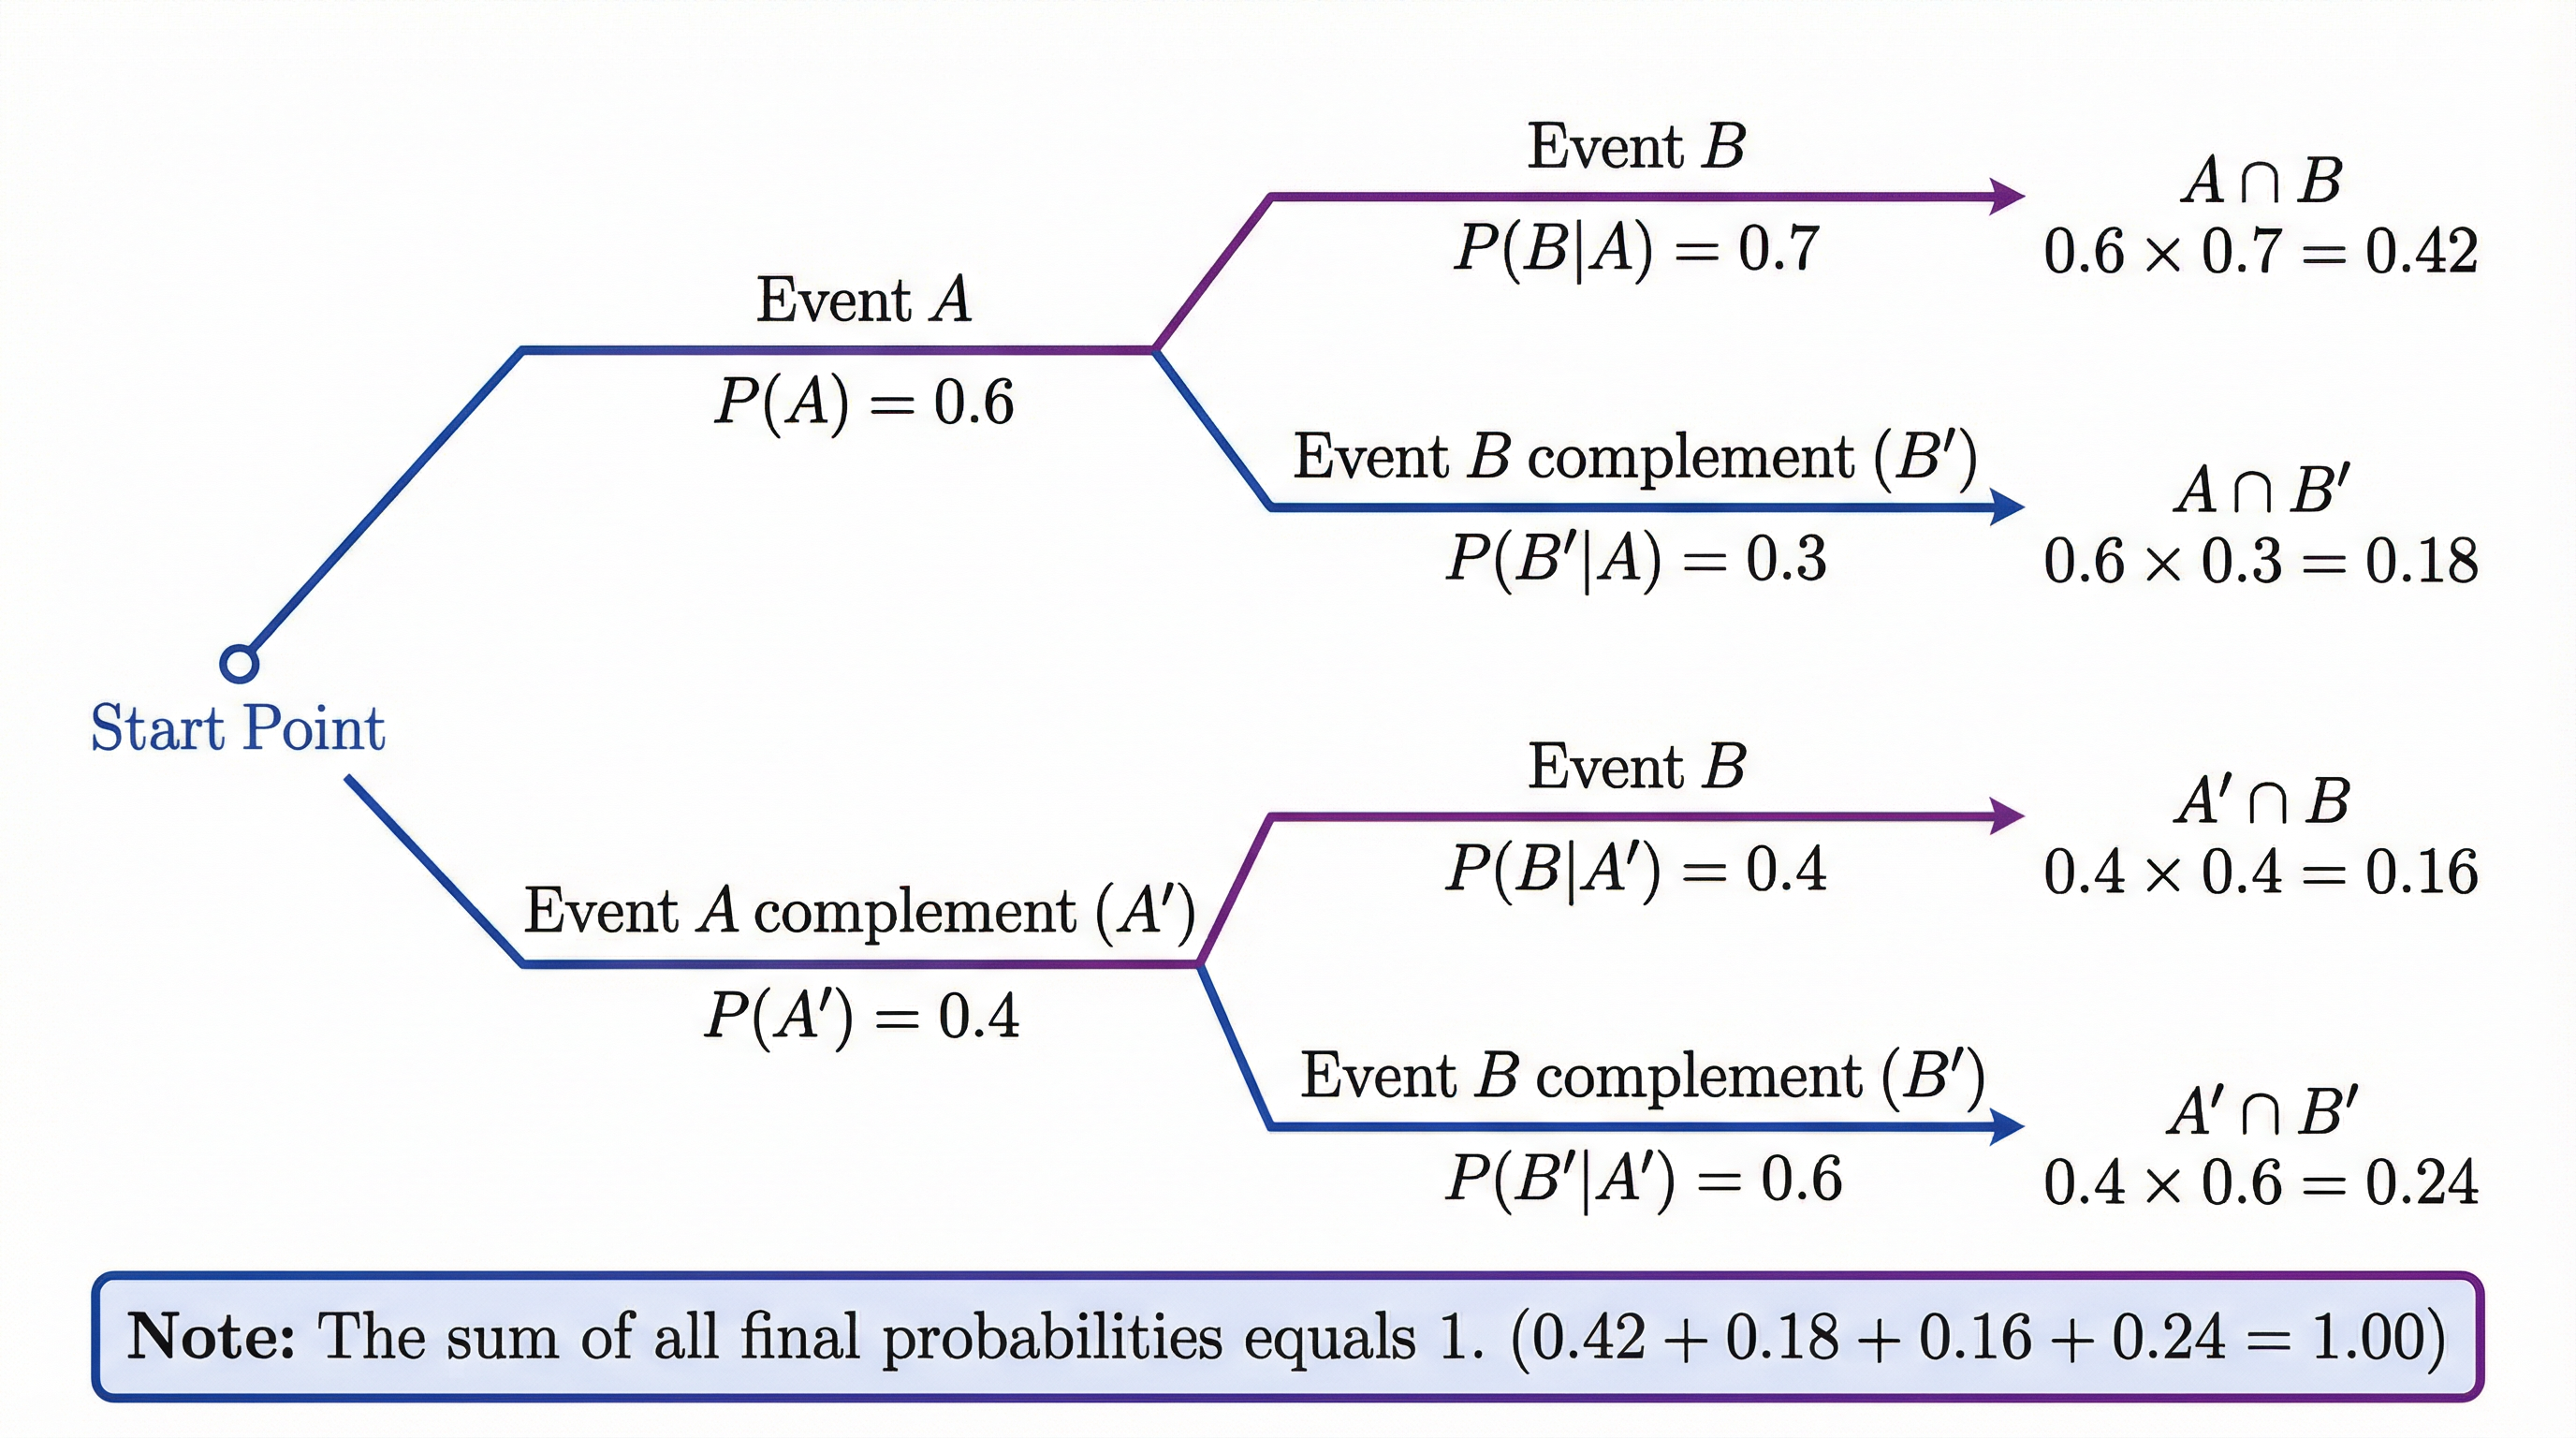
Solution: Step 1: Draw a tree diagram to represent the two stages. The first branches will be Red (R) and Blue (B). Step 2: Label the probabilities for the first draw. P(R) = 3/8 and P(B) = 5/8. Step 3: Draw the second set of branches. From the first R branch, the probabilities for the second draw are P(R|R) = 2/7 and P(B|R) = 5/7 (since one red ball is gone). From the first B branch, the probabilities are P(R|B) = 3/7 and P(B|B) = 4/7. This setup earns M1 A1. Step 4: Identify the two paths where the second ball is red: (Red and Red) OR (Blue and Red). Step 5: Calculate the probability of each path by multiplying along the branches. P(R and R) = (3/8) × (2/7) = 6/56. P(B and R) = (5/8) × (3/7) = 15/56. This earns M1. Step 6: Add the probabilities of these two mutually exclusive paths. P(Second is Red) = 6/56 + 15/56 = 21/56. This earns A1. Final answer: 21/56 or 3/8.
Worked Example
Question: In a school, 60% of students have a laptop. 30% of students have a tablet. Given that a student has a laptop, the probability they also have a tablet is 0.2. Find the probability that a student has neither a laptop nor a tablet.
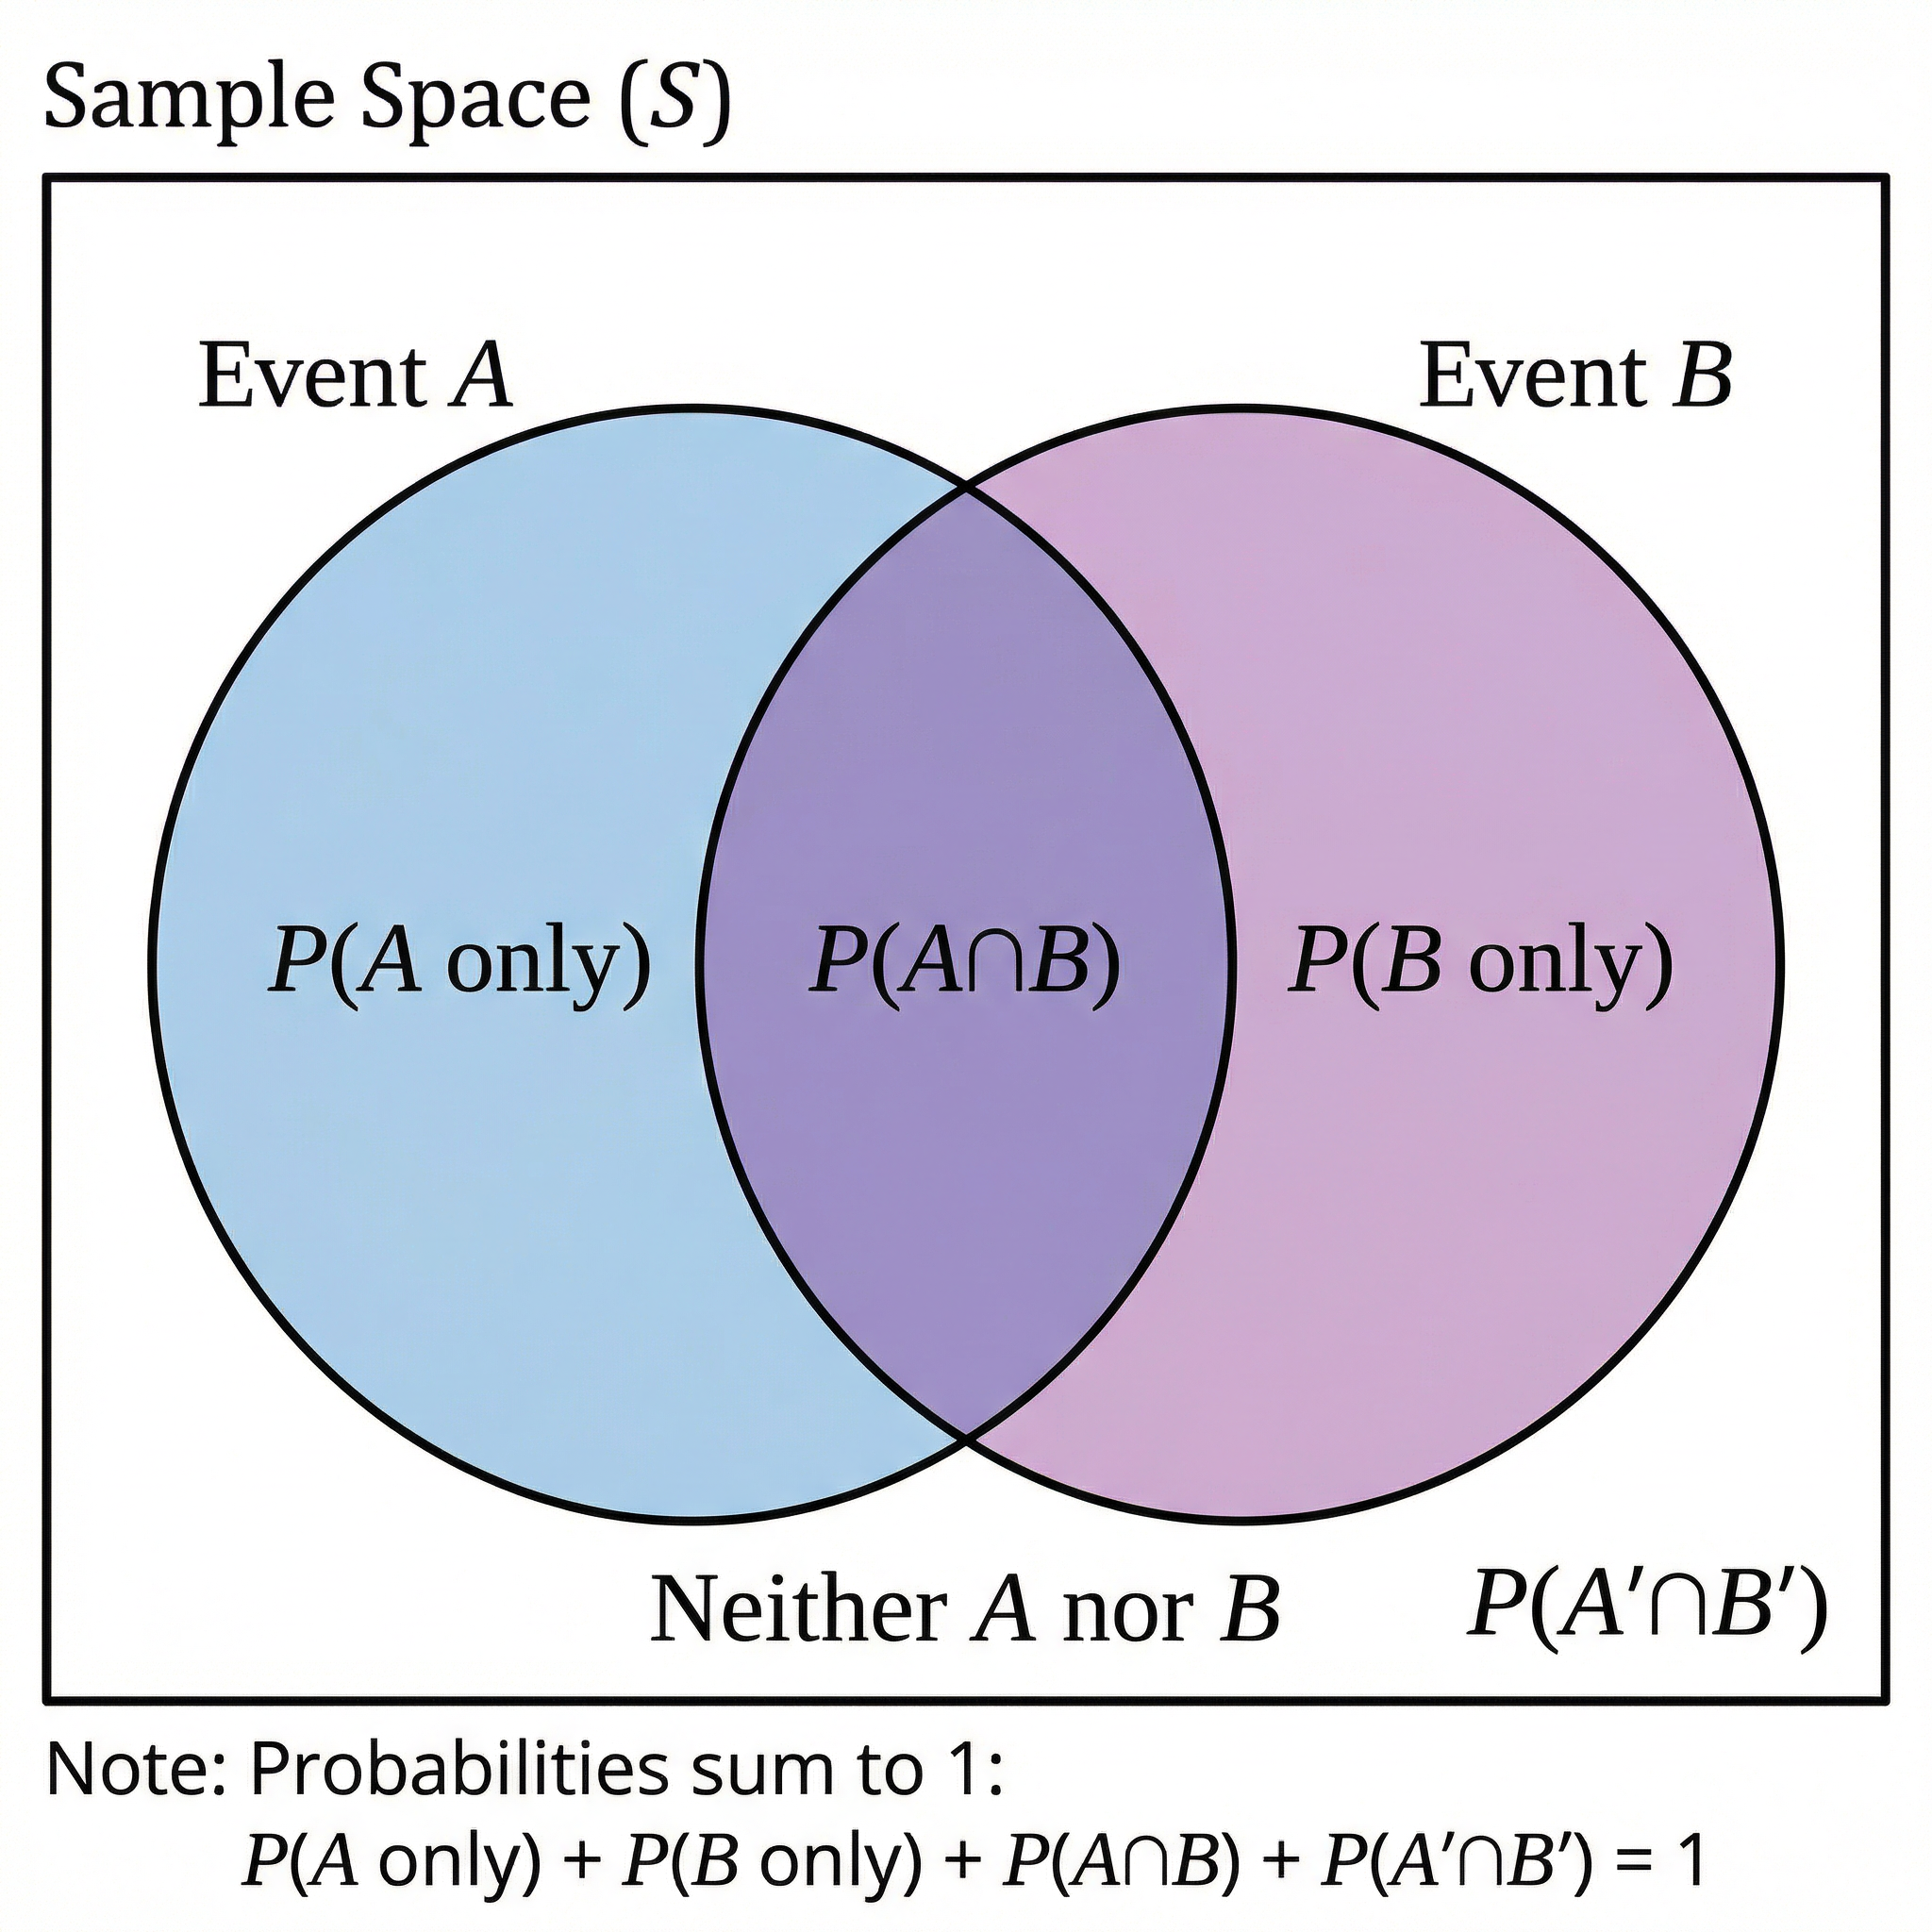
Solution: Step 1: Define events. Let L be the event a student has a laptop and T be the event a student has a tablet. P(L) = 0.6, P(T) = 0.3. Step 2: Interpret the conditional probability. 'Given that a student has a laptop, the probability they also have a tablet is 0.2' means P(T|L) = 0.2. This earns B1. Step 3: Use the conditional probability formula to find the intersection. P(T|L) = P(T ∩ L) / P(L). So, 0.2 = P(T ∩ L) / 0.6. This earns M1. Step 4: Calculate the intersection. P(T ∩ L) = 0.2 × 0.6 = 0.12. This earns A1. Step 5: Use the addition rule to find the union. P(L ∪ T) = P(L) + P(T) - P(L ∩ T) = 0.6 + 0.3 - 0.12 = 0.78. This earns M1. Step 6: Find the probability of having neither. This is the complement of the union. P(L' ∩ T') = 1 - P(L ∪ T) = 1 - 0.78 = 0.22. This earns A1. Final answer: 0.22.
Practice Questions
Question: Given that P(A) = 0.5, P(B) = 0.6 and P(A ∩ B) = 0.3, state with a reason whether events A and B are independent.
Answer:
Question: A survey in a town showed that 70% of people own a car, 45% own a bicycle, and 20% own neither. Find the probability that a randomly selected person owns both a car and a bicycle.
Answer:
Question: There are 8 counters in a bag: 3 are red and 5 are green. A counter is taken out, not replaced, and then another is taken. Given that the second counter is green, what is the probability that the first counter was also green?
Answer:
Question: Events A and B are such that P(A) = 2x, P(B) = x and P(A ∪ B) = 0.7. Given that A and B are mutually exclusive, find the value of x.
Answer:
Question: Events A and B are independent. P(A) = 0.25 and P(A ∪ B) = 0.6. Find P(B).
Answer: