Subject: Mathematics | Level: GCSE | Exam Board: OCR
Master OCR GCSE Probability, from tree diagrams to conditional events. This guide breaks down complex concepts into mark-scoring techniques, using worked examples and examiner insights to show you exactly how to secure top grades.
Revision Notes & Key Concepts
Key Terms & Definitions
- Mutually Exclusive
- Events that cannot happen at the same time. For example, rolling a 5 and rolling a 6 on a single die are mutually exclusive.
- Independent Events
- The outcome of one event has no effect on the outcome of another. For example, flipping a coin and then rolling a die.
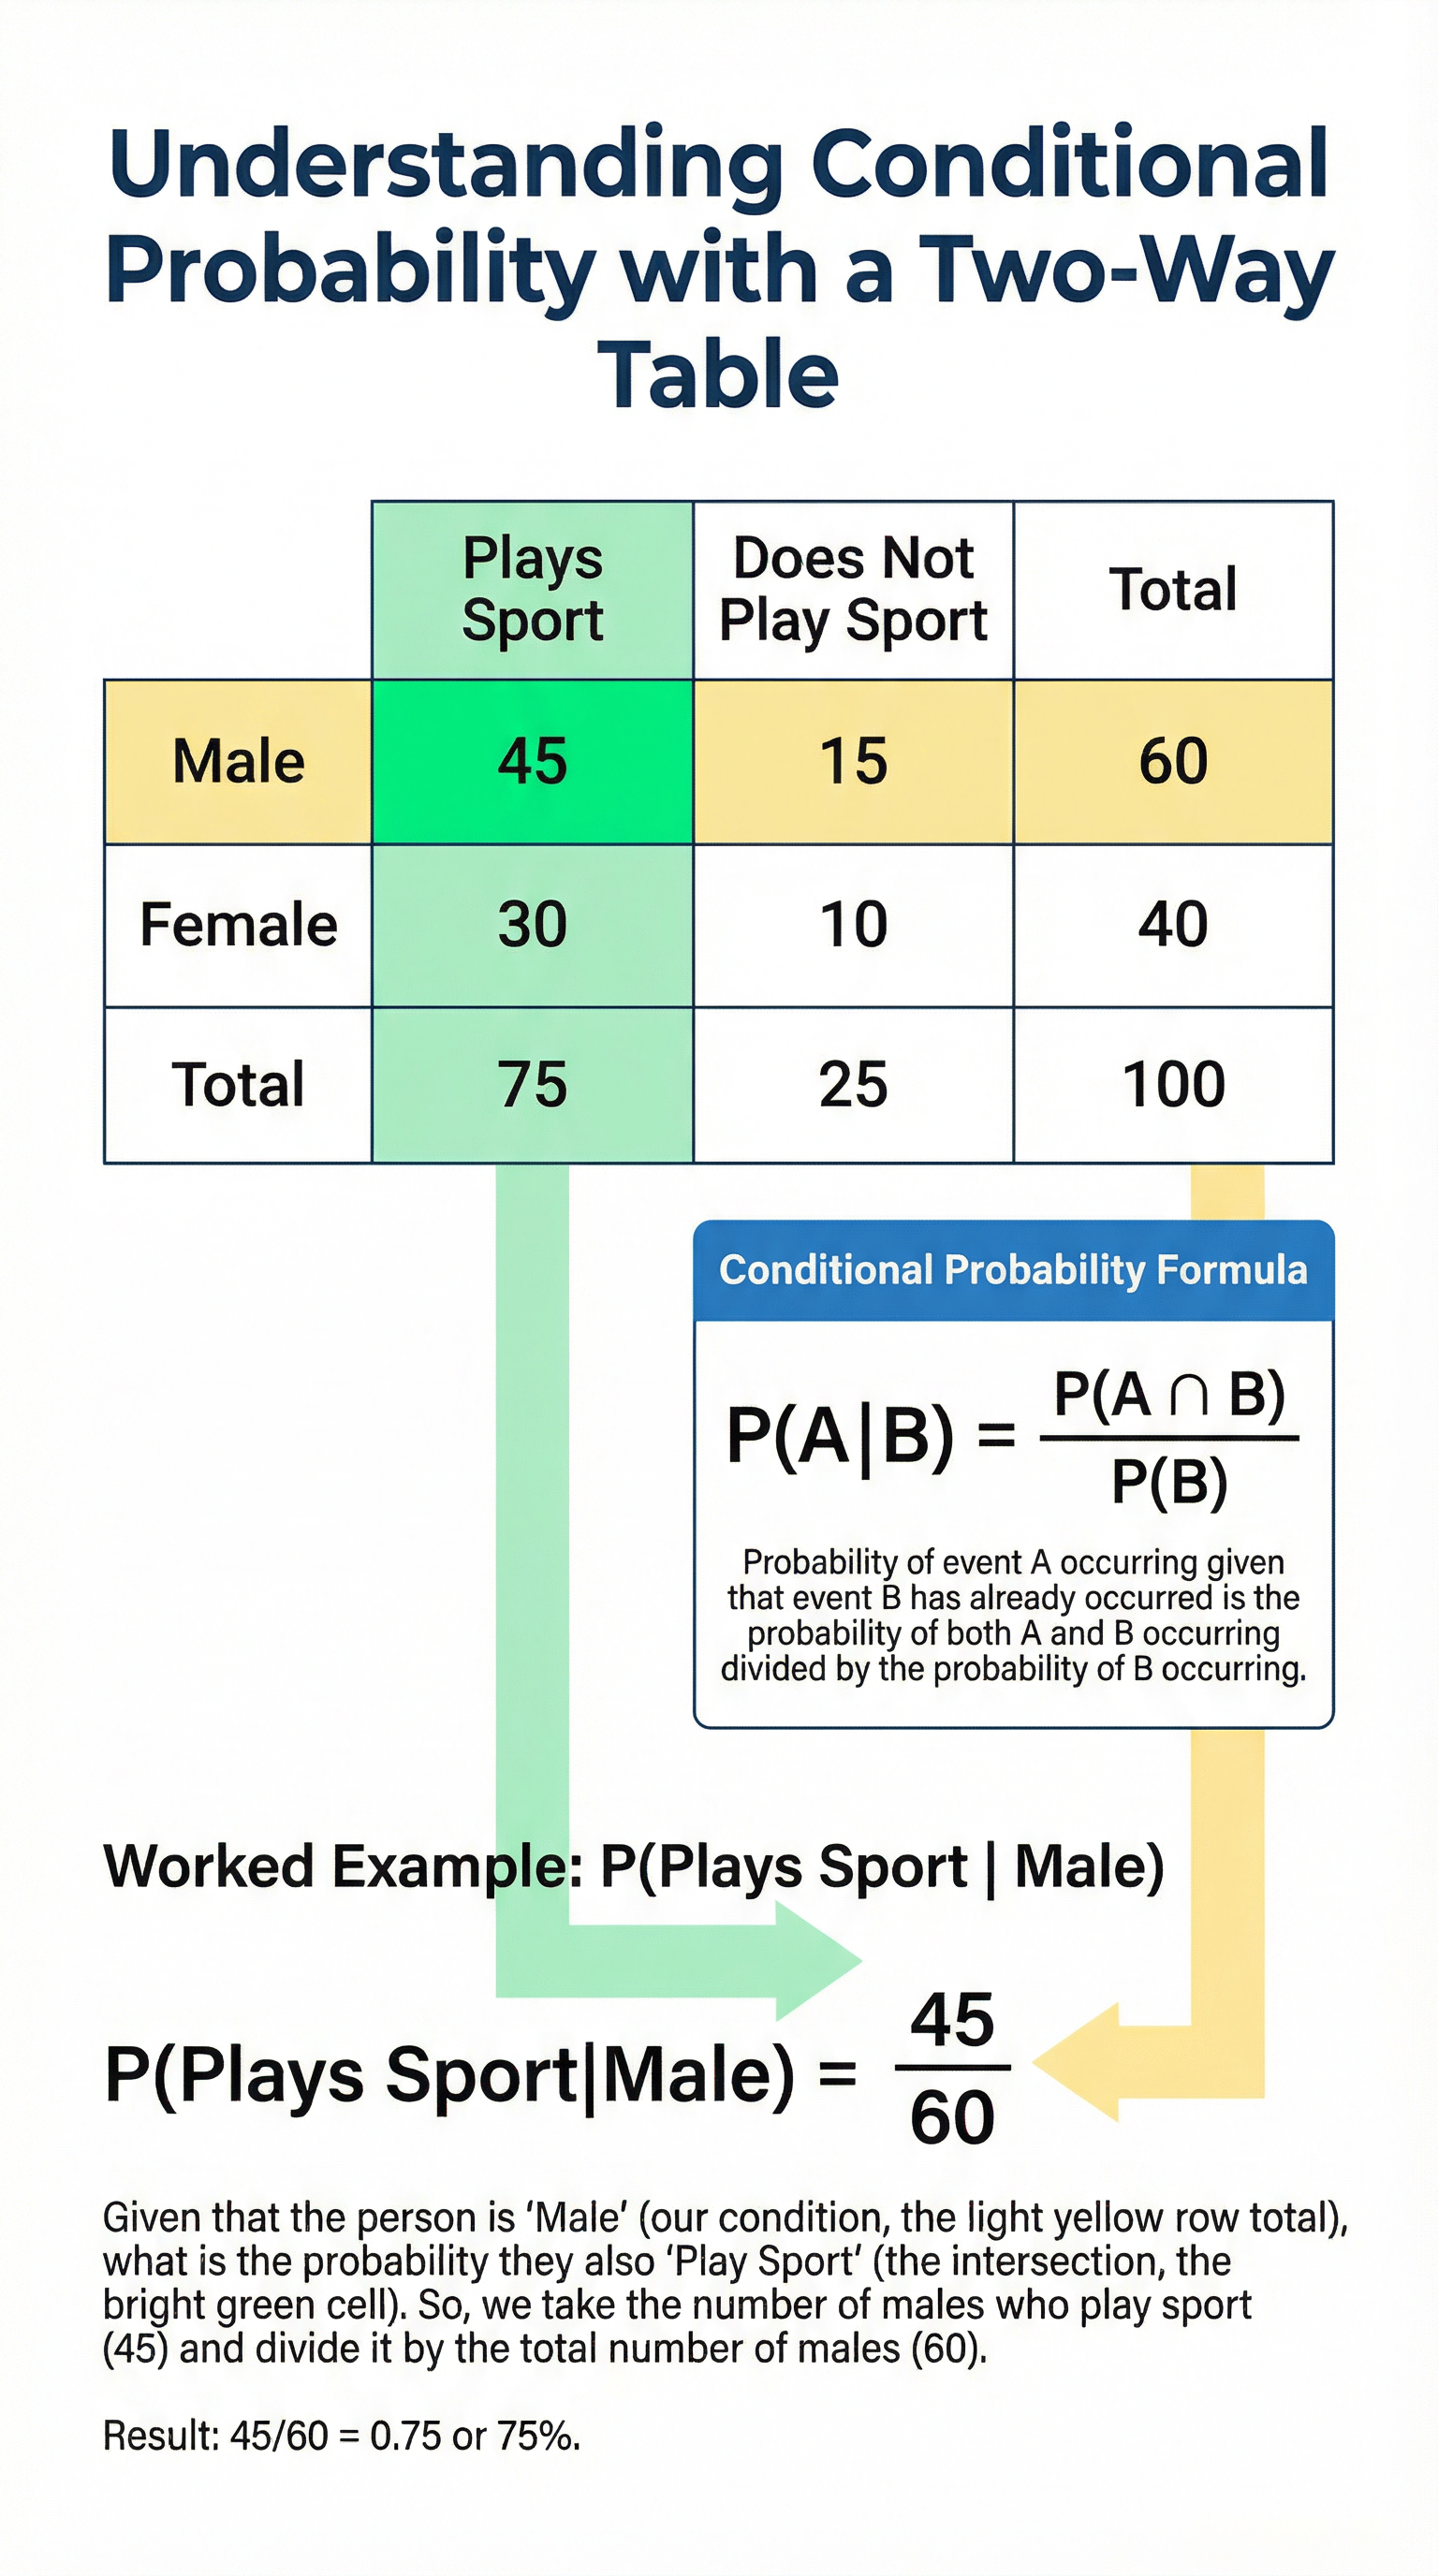
- Conditional Probability
- The probability of an event occurring, given that another event has already occurred.
- Relative Frequency
- An estimate of probability based on experimental data. It is calculated as: (Number of times an event occurs) / (Total number of trials).
- Exhaustive Events
- A set of events that covers all possible outcomes. For example, the events 'rolling an even number' and 'rolling an odd number' on a die are exhaustive.
- Intersection (A ∩ B)
- The set of outcomes that are in both event A and event B.
Worked Examples
Worked Example
Question: Hannah has a bag containing 10 sweets. 6 are red and 4 are green. She takes a sweet at random, eats it, and then takes another. Calculate the probability that she eats two sweets of different colours.
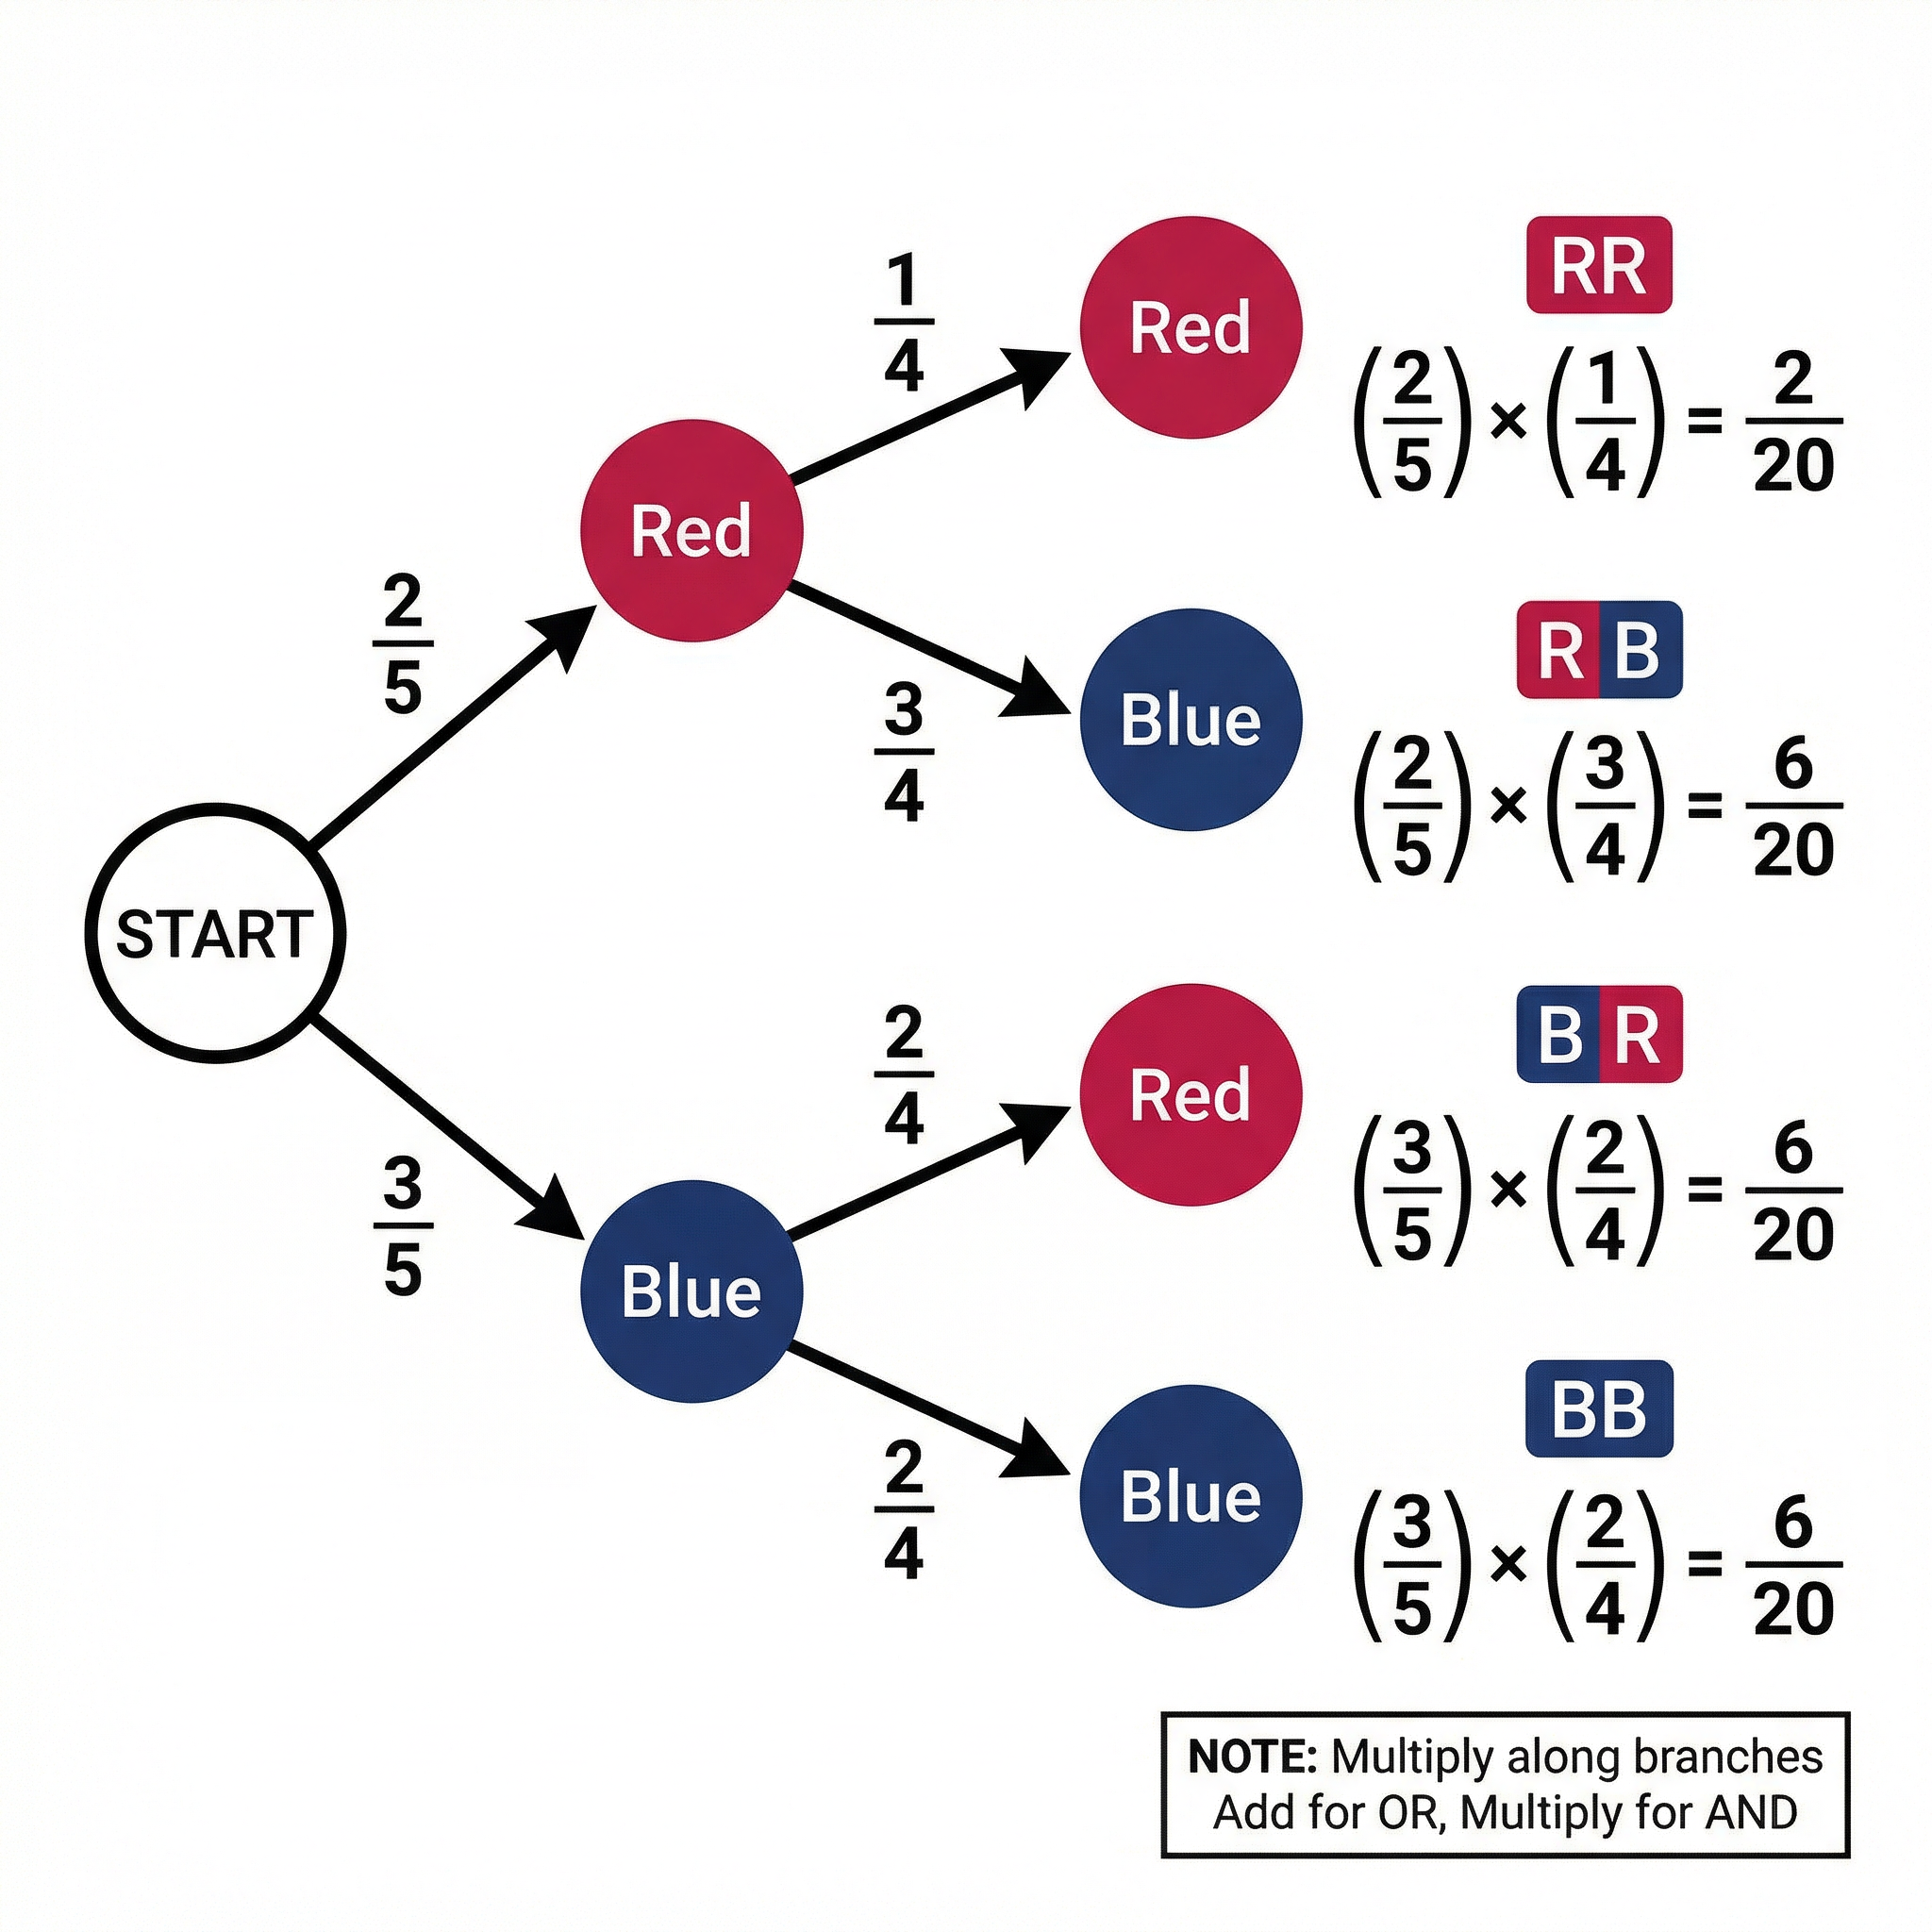
Solution: Step 1: Draw the first stage branches of a tree diagram. P(Red) = 6/10 and P(Green) = 4/10. Step 2: Draw the second stage branches. Since the first sweet is eaten, there are only 9 sweets left. - If the first was Red, P(second Red) = 5/9 and P(second Green) = 4/9. - If the first was Green, P(second Red) = 6/9 and P(second Green) = 3/9. Step 3: Identify the paths for 'different colours'. These are Red then Green (RG) and Green then Red (GR). Step 4: Calculate the probability for each path using the AND rule (multiply along branches). - P(R and G) = (6/10) * (4/9) = 24/90. - P(G and R) = (4/10) * (6/9) = 24/90. Step 5: Calculate the final probability using the OR rule (add the paths). - P(two different colours) = P(RG) + P(GR) = 24/90 + 24/90 = 48/90. Final answer: 48/90 (or simplified to 8/15).
Worked Example
Question: In a group of 30 students, 18 have a brother (B), 15 have a sister (S), and 8 have neither. A student is chosen at random. Find the probability that they have a sister, given that they have a brother.
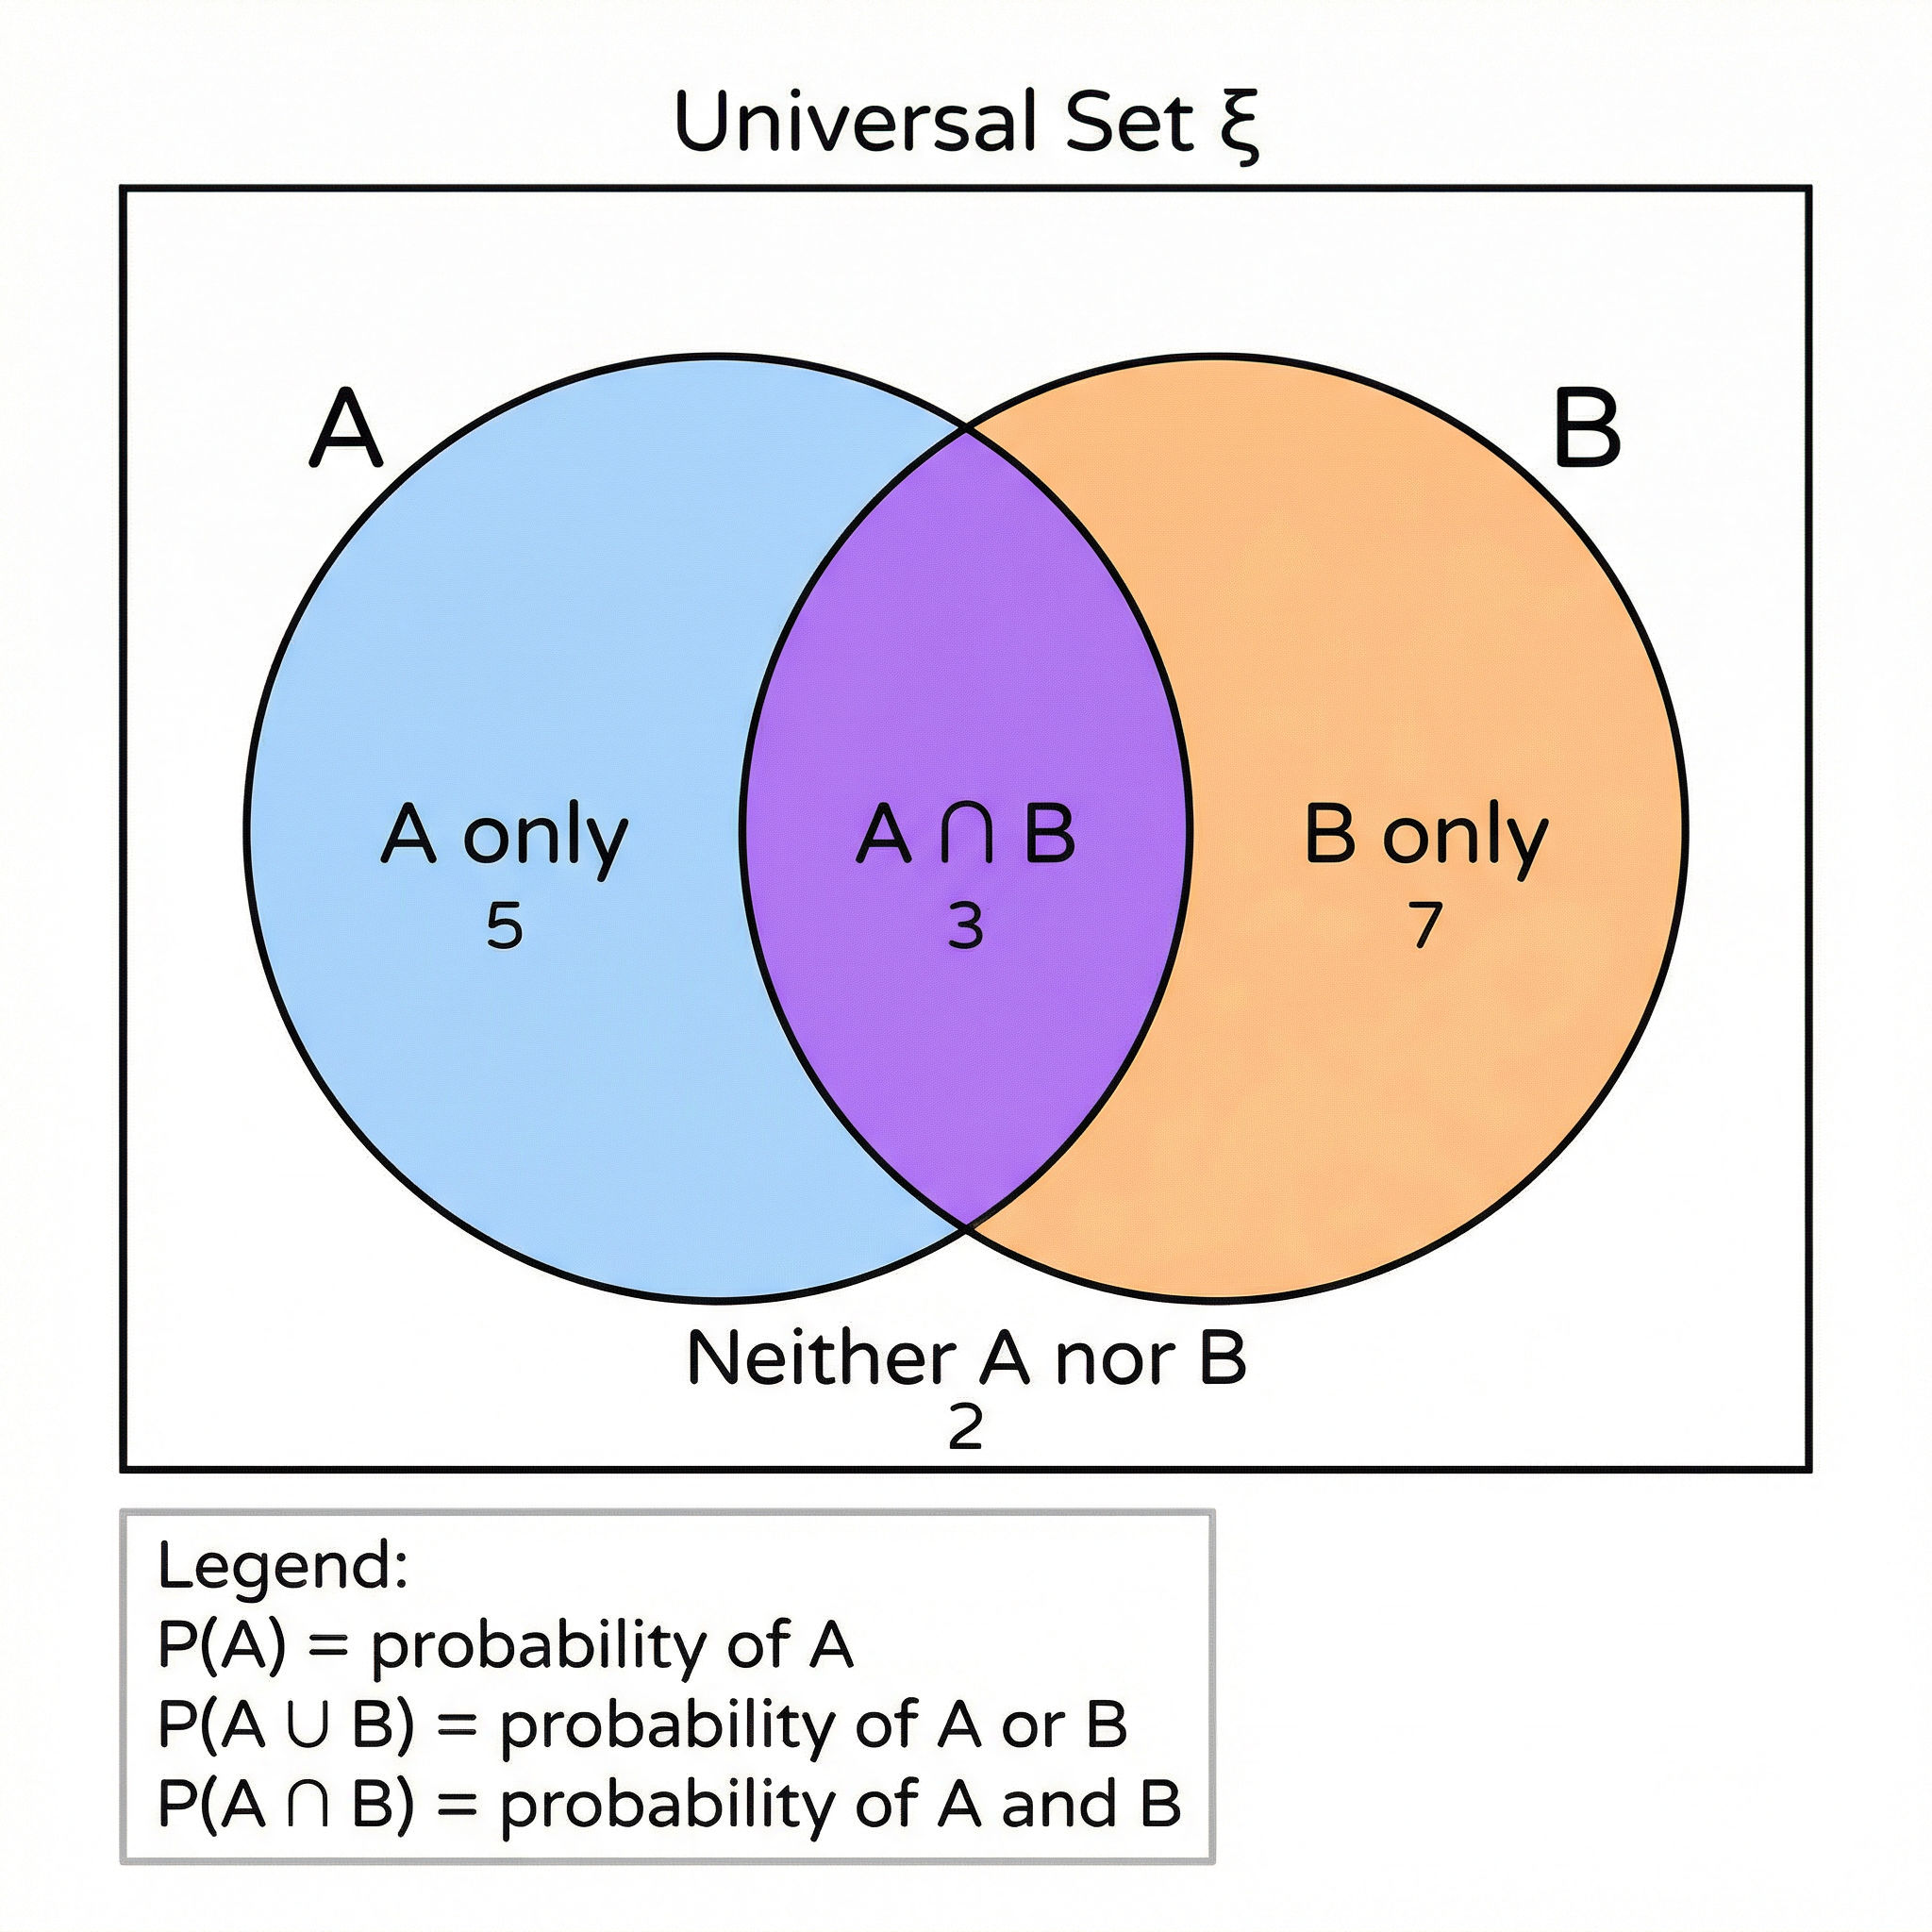
Solution: Step 1: Draw a Venn diagram to represent the information. The universal set ξ = 30. Step 2: The number outside the circles is 8 (neither). So, the number of students with a brother or a sister (or both) is 30 - 8 = 22. This is the union, B ∪ S. Step 3: Use the formula P(B ∪ S) = P(B) + P(S) - P(B ∩ S) to find the intersection. Let the number in the intersection be x. The total number of people is 18 + 15 - x = 22. So, 33 - x = 22, which means x = 11. The number in the intersection (B ∩ S) is 11. Step 4: Fill the rest of the Venn diagram. Number with only a brother = 18 - 11 = 7. Number with only a sister = 15 - 11 = 4. Step 5: The question asks for P(S|B) - the probability of having a sister GIVEN they have a brother. Our 'world' is now just the 18 students who have a brother. Of these 18, the number who also have a sister is the intersection, which is 11. Final answer: 11/18.
Worked Example
Question: The probability that a biased coin lands on Heads is p. The coin is flipped twice. The probability of getting two Heads is 0.16. Show that the probability of getting one Head and one Tail is 0.48.
Solution: Step 1: Define the probabilities for a single flip. P(Head) = p. Since there are only two outcomes, P(Tail) = 1 - p. Step 2: Set up an equation for the probability of two Heads. P(Head and Head) = P(Head) * P(Head) = p * p = p². Step 3: Use the given information to solve for p. We are told p² = 0.16. Therefore, p = √0.16 = 0.4. (We take the positive root as probability cannot be negative). Step 4: Calculate P(Tail). P(Tail) = 1 - p = 1 - 0.4 = 0.6. Step 5: Identify the outcomes for 'one Head and one Tail'. These are Head then Tail (HT) and Tail then Head (TH). Step 6: Calculate the probability of these combined outcomes. - P(HT) = p * (1-p) = 0.4 * 0.6 = 0.24. - P(TH) = (1-p) * p = 0.6 * 0.4 = 0.24. - P(one of each) = P(HT) + P(TH) = 0.24 + 0.24 = 0.48. Final answer: The calculation explicitly shows the probability is 0.48.
Practice Questions
Question: A fair six-sided die and a fair coin are thrown. What is the probability of getting a number greater than 4 and a Head?
Answer:
Question: There are 120 students in Year 11. 60 study French, 50 study Spanish, and 20 study both. Draw a Venn diagram and use it to find the probability that a randomly selected student studies neither French nor Spanish.
Answer:
Question: A bag contains 5 red beads and 3 blue beads. A bead is taken, its colour noted, and it is NOT replaced. A second bead is then taken. What is the probability that the two beads are the same colour?
Answer:
Question: The probability of a biased die landing on a 6 is 0.3. The die is rolled 200 times. Work out an estimate for the number of times the die will NOT land on a 6.
Answer:
Question: There are n sweets in a bag. 6 of the sweets are orange. The rest of the sweets are yellow. A sweet is taken at random and eaten. The probability that the sweet is orange is 6/n. A second sweet is then taken. The probability that both sweets are orange is 1/3. Show that n² - n - 90 = 0 and find the value of n.
Answer: