Pearson Edexcel · A-Level · Mathematics
Course version: 9MA0 · Version from Mar 2026
Recognise and interpret possible outliers in data sets and statistical…
Full specification wording
Data presentation and interpretation: 2.4 Recognise and interpret possible outliers in data sets and statistical diagrams. Select or critique data presentation techniques in the context of a statistical problem. Be able to clean data, including dealing with missing data, errors and outliers.
An outlier is a value that lies far from the rest of the data.
Checked against the Pearson Edexcel 9MA0 specification (opens in a new tab) on .
- Point 4 of 4
- 4 key terms
Study notes
From the checked teaching notes for this specification point.
The idea
An outlier is a value that lies far from the rest of the data. A common rule flags values below the lower quartile minus 1.5 times the interquartile range or above the upper quartile plus 1.5 times the interquartile range. Outliers may be genuine extreme values or errors, so interpret them in context before deciding what to do. Selecting or critiquing presentation means choosing a diagram or summary that suits the data, for example a box plot for spread and outliers or a histogram for distribution shape, and explaining the strengths and limitations of that choice. Cleaning data means checking for missing values, impossible or misrecorded entries and outliers, then deciding whether to correct, exclude or retain each one and stating the effect on the analysis.
What earns the marks
- Identifies possible outliers using a stated rule such as quartiles and 1.5 times the interquartile range.
- Interprets an outlier in context, distinguishing a genuine extreme value from a likely error.
- Selects a suitable data presentation technique for a given statistical problem and justifies the choice.
- Critiques a given presentation by commenting on its suitability, clarity or possible distortion.
- Cleans a data set by identifying missing values, errors and outliers and explaining the treatment of each.
Common mistakes and how to put them right
Removing every outlier automatically without checking whether it is genuine.
Put it right: Interpret each value in context before deciding.
Using the mean and range to identify outliers when the data is skewed.
Put it right: Use quartiles and the interquartile range, which are resistant to extreme values.
Ignoring missing data and treating the remaining values as complete.
Put it right: State how many values are missing and how they were handled.
Exam tips
- Show the quartiles and the 1.5 times interquartile range boundaries when identifying outliers.
- When critiquing a diagram, give one strength and one limitation linked to the data and the question.
- For cleaning data, state clearly what you did with each problem value and the effect on your conclusion.
Try the lesson
The start of the Data presentation and interpretation: 2.4 Recognise and interpret possible outliers in data sets and statistical diagrams. Select or critique data presentation techniques in the context of a statistical problem. Be able to clean data, including dealing with missing data, errors and outliers. lesson, made from checked teaching notes for this specification point.
Have a go first
A data set of 20 values has a lower quartile of 12 and an upper quartile of 28. Using the 1.5 × IQR rule, which value would be classified as an outlier?
Listen
An outlier is a value that lies far from the rest of the data. A common rule flags values below the lower quartile minus 1.5 times the interquartile range or above the upper quartile plus 1.5 times the interquartile range. Outliers may be genuine extreme values or errors, so interpret them in context before deciding what to do. Selecting or critiquing presentation means choosing a diagram or summary that suits the data, for example a box plot for spread and outliers or a histogram for distribution shape, and explaining the strengths and limitations of that choice. Cleaning data means checking for missing values, impossible or misrecorded entries and outliers, then deciding whether to correct, exclude or retain each one and stating the effect on the analysis. A strong answer earns marks for these points. Identifies possible outliers using a stated rule such as quartiles and 1.5 times the interquartile range. Interprets an outlier in context, distinguishing a genuine extreme value from a likely error. Selects a suitable data presentation technique for a given statistical problem and justifies the choice. Critiques a given presentation by commenting on its suitability, clarity or possible distortion. A common slip: Removing every outlier automatically without checking whether it is genuine. Instead, interpret each value in context before deciding. Exam tip: Show the quartiles and the 1.5 times interquartile range boundaries when identifying outliers.
See it
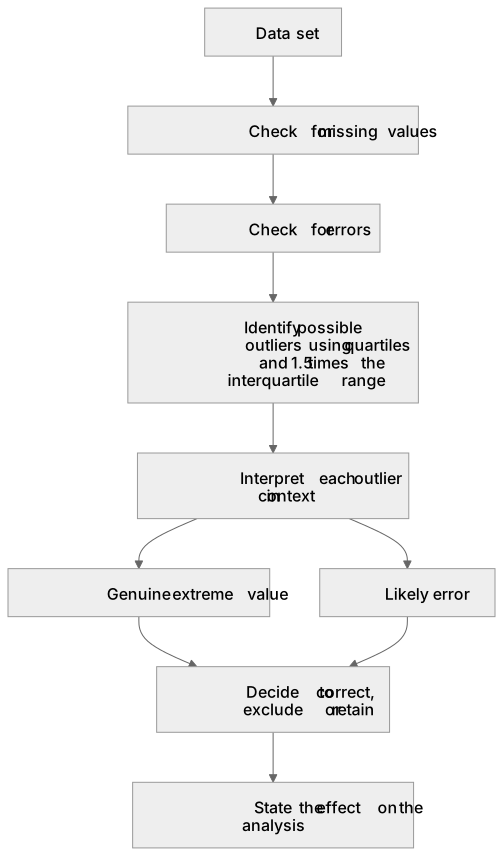
Key words
Say what each word means before you turn the card.
Outlier
Try answering aloud or in your head before turning the card.
Quartiles and interquartile range
Try answering aloud or in your head before turning the card.
Selecting or critiquing presentation
Try answering aloud or in your head before turning the card.
Cleaning data
Try answering aloud or in your head before turning the card.
See every definition
- Outlier
- A value that lies far from the rest of the data, which may be a genuine extreme value or an error.
- Quartiles and interquartile range
- Summaries used to identify possible outliers, being resistant to extreme values where the mean and range are not.
- Selecting or critiquing presentation
- Choosing a diagram or summary that suits the data and explaining the strengths and limitations of that choice.
- Cleaning data
- Checking for missing values, impossible or misrecorded entries and outliers, then deciding whether to correct, exclude or retain each one.
Label the diagram
Some boxes have lost their names. Pick the right name for each number.
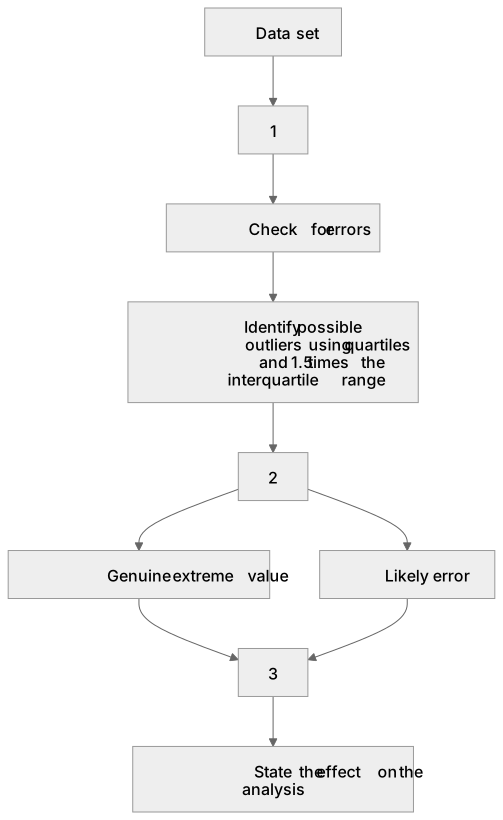
1Box 1
2Box 2
3Box 3
There is more to this lesson
The full lesson goes on to check your understanding and help you earn the marks. Create a free account to carry on, with your progress saved.
A week of Premium from your first lesson · Then the free plan continues · No card, no charge
Test your understanding of Data presentation and interpretation: 2.4 Recognise and interpret possible outliers in data sets and statistical diagrams. Select or critique data presentation techniques in the context of a statistical problem. Be able to clean data, including dealing with missing data, errors and outliers.
Active recall beats re-reading. Take an instant quiz now to test what you’ve learned and lock it into long-term memory.
A week of Premium from your first lesson · Then the free plan continues · No card, no charge