Pearson Edexcel · GCSE · Mathematics
Course version: 1MA1 · Version from Mar 2026
Use and interpret scatter graphs of bivariate data; recognise correlation…
Full specification wording
Statistics: use and interpret scatter graphs of bivariate data; recognise correlation and know that it does not indicate causation; draw estimated lines of best fit; make predictions; interpolate and extrapolate apparent trends while knowing the dangers of so doing
A scatter graph plots two measurements for each item, one against each axis, so you can see whether the two quantities are linked.
Checked against the Pearson Edexcel 1MA1 specification (opens in a new tab) on .
- Point 7 of 7
- 4 key terms
Study notes
From the checked teaching notes for this specification point.
The idea
A scatter graph plots two measurements for each item, one against each axis, so you can see whether the two quantities are linked. Points rising from left to right show positive correlation, points falling show negative correlation, and points with no pattern show none. Describe strength as well as direction, since points lying close to a straight line show strong correlation. A line of best fit is one straight line following the trend with roughly as many points above it as below, and it need not pass through the origin. Predictions are read off that line, for example going up from 6 hours of revision to the line and across to about 48 marks. A reading taken inside the range of the plotted data is interpolation and is fairly safe; going beyond that range is extrapolation, where the trend may not continue. Correlation alone never shows that one quantity causes the other.
What earns the marks
- Plotting every point correctly against both scales.
- A ruled line of best fit that follows the trend of the points.
- A reading taken from your own line of best fit, even if the line is not the expected one.
- Naming the type of correlation, and a further mark for saying what it means about the two quantities in context.
- A comment on reliability that refers to the range of the data collected.
Common mistakes and how to put them right
Joining the points in order instead of drawing a single straight line of best fit.
Forcing the line of best fit through the origin, or through the first and last points only.
Writing that the correlation proves one quantity causes the other.
Reading a prediction off a nearby plotted point rather than off the line of best fit.
Extending the line well past the data and giving the prediction with no comment on its reliability.
Exam tips
- Draw the line of best fit in pencil and check that the points are balanced on both sides of it before taking any reading.
- Show a prediction with dashed lines from the axis to the line and back, so the method can be credited.
- If the value you are asked to predict lies outside the range of the plotted data, say so and say why the answer may be unreliable.
Try the lesson
The start of the Statistics: use and interpret scatter graphs of bivariate data; recognise correlation and know that it does not indicate causation; draw estimated lines of best fit; make predictions; interpolate and extrapolate apparent trends while knowing the dangers of so doing lesson, made from checked teaching notes for this specification point.
Have a go first
A scatter graph shows the number of hours spent revising and the test score for each of 20 students. The points lie close to a straight line that slopes downwards from left to right. Describe the correlation shown by the scatter graph.
Listen
A scatter graph plots two measurements for each item, one against each axis, so you can see whether the two quantities are linked. Points rising from left to right show positive correlation, points falling show negative correlation, and points with no pattern show none. Describe strength as well as direction, since points lying close to a straight line show strong correlation. A line of best fit is one straight line following the trend with roughly as many points above it as below, and it need not pass through the origin. Predictions are read off that line, for example going up from 6 hours of revision to the line and across to about 48 marks. A reading taken inside the range of the plotted data is interpolation and is fairly safe; going beyond that range is extrapolation, where the trend may not continue. Correlation alone never shows that one quantity causes the other. A strong answer earns marks for these points. plotting every point correctly against both scales. a ruled line of best fit that follows the trend of the points. a reading taken from your own line of best fit, even if the line is not the expected one. naming the type of correlation, and a further mark for saying what it means about the two quantities in context. Exam tip: Draw the line of best fit in pencil and check that the points are balanced on both sides of it before taking any reading.
See it
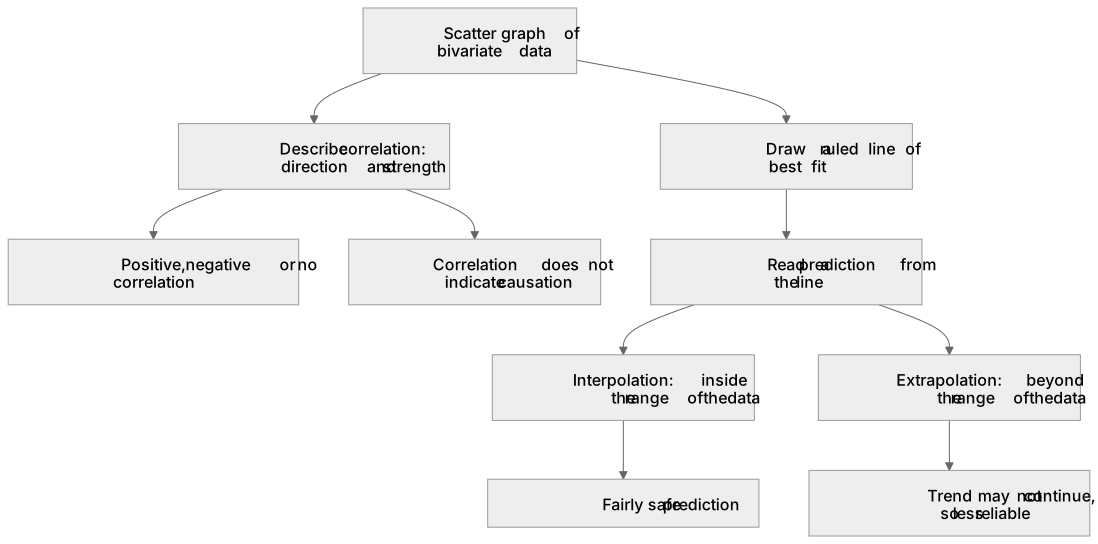
Key words
Say what each word means before you turn the card.
scatter graphs
Try answering aloud or in your head before turning the card.
correlation and causation
Try answering aloud or in your head before turning the card.
line of best fit
Try answering aloud or in your head before turning the card.
interpolation and extrapolation
Try answering aloud or in your head before turning the card.
See every definition
- scatter graphs
- A graph that plots two measurements for each item, one against each axis, so you can see whether the two quantities are linked.
- correlation and causation
- Points rising from left to right show positive correlation and points falling show negative correlation, but correlation alone never shows that one quantity causes the other.
- line of best fit
- One straight line following the trend with roughly as many points above it as below, which need not pass through the origin.
- interpolation and extrapolation
- A reading taken inside the range of the plotted data is interpolation and is fairly safe, while going beyond that range is extrapolation, where the trend may not continue.
Label the diagram
Some boxes have lost their names. Pick the right name for each number.
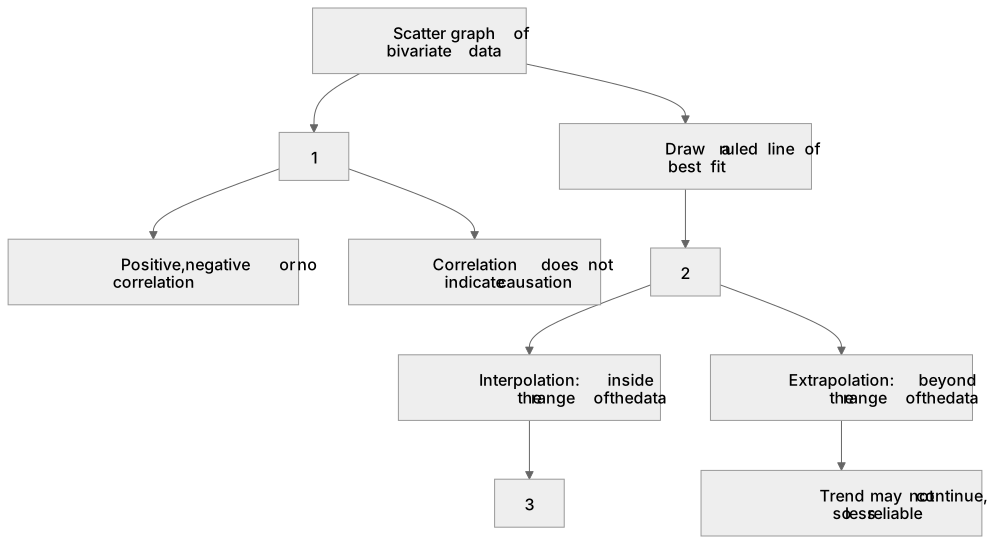
1Box 1
2Box 2
3Box 3
There is more to this lesson
The full lesson goes on to check your understanding and help you earn the marks. Create a free account to carry on, with your progress saved.
A week of Premium from your first lesson · Then the free plan continues · No card, no charge
Test your understanding of Statistics: use and interpret scatter graphs of bivariate data; recognise correlation and know that it does not indicate causation; draw estimated lines of best fit; make predictions; interpolate and extrapolate apparent trends while knowing the dangers of so doing
Active recall beats re-reading. Take an instant quiz now to test what you’ve learned and lock it into long-term memory.
A week of Premium from your first lesson · Then the free plan continues · No card, no charge