AQA · A-Level · Physical Education
Course version: 7582 · Version from Sept 2016
Students should be able to understand and interpret graphical…
Full specification wording
Skill acquisition: Students should be able to understand and interpret graphical representations associated with skill acquisition theories.
Graphs may show relationships such as arousal against performance, learning curves over time, or feedback effects.
Checked against the AQA 7582 specification (opens in a new tab) on .
- 3 key terms
Study notes
From the checked teaching notes for this specification point.
The idea
Graphs may show relationships such as arousal against performance, learning curves over time, or feedback effects. For example, the inverted-U graph shows performance rising to an optimum arousal point, then falling as arousal continues to increase. A learning curve may plateau, then improve with practice. To interpret a graph, read the axes, identify the trend, and relate it to the theory. You must also recognise when a graph does not support a theory, such as a linear relationship where the inverted-U is expected.
What earns the marks
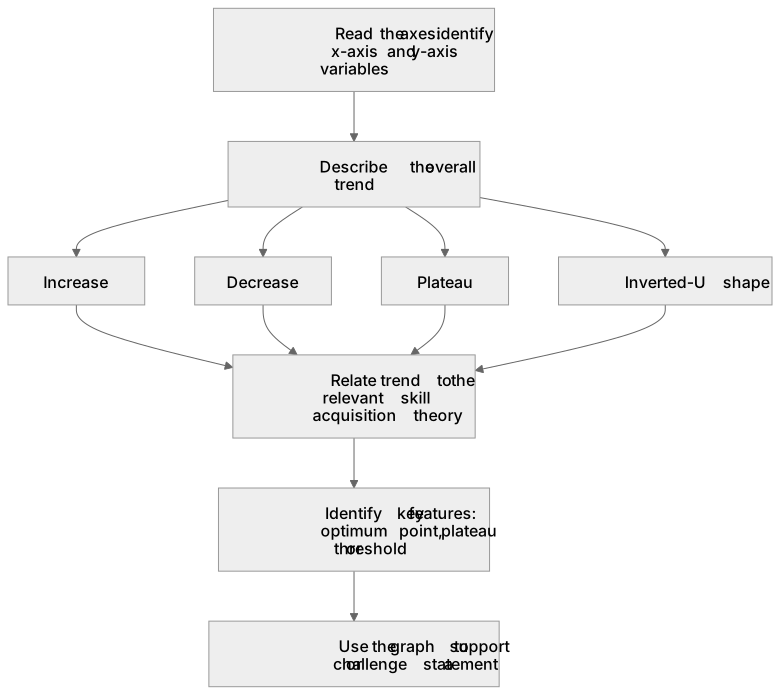
- Identify the variables on the x-axis and y-axis of the graph.
- Describe the overall trend shown, such as increase, decrease, plateau or inverted-U shape.
- Relate the trend to the relevant skill acquisition theory, for example arousal and performance or learning curves.
- Use the graph to support or challenge a statement about skill acquisition.
- Recognise key features such as optimum point, plateau or threshold.
Common mistakes and how to put them right
Students often read the axes incorrectly, for example confusing arousal with anxiety.
Put it right: Check the axis label and units before interpreting the trend.
Students often describe the graph without linking it to a theory.
Put it right: State which skill acquisition theory the graph represents and how the trend supports it.
Students often assume all learning curves are the same shape.
Put it right: Learning curves can show rapid improvement, plateau or gradual improvement depending on the performer and task.
Students often ignore the optimum point on an inverted-U graph.
Put it right: Identify the peak as the optimum arousal level for performance.
Exam tips
- Underline the axis labels and key features such as peak or plateau before reading the question options.
- If a graph shows an inverted-U, check whether the question asks about arousal or another variable, as the shape may be similar but the label matters.
- Practise converting a graph into a one-sentence description, then match it to the theory.
Try the lesson
The start of the Skill acquisition: Students should be able to understand and interpret graphical representations associated with skill acquisition theories. lesson, made from checked teaching notes for this specification point.
Have a go first
A graph of performance against number of practice attempts shows a curve that rises steeply at first and then levels off. What does the levelling-off section of this learning curve represent?
Listen
Graphs may show relationships such as arousal against performance, learning curves over time, or feedback effects. For example, the inverted-U graph shows performance rising to an optimum arousal point, then falling as arousal continues to increase. A learning curve may plateau, then improve with practice. To interpret a graph, read the axes, identify the trend, and relate it to the theory. You must also recognise when a graph does not support a theory, such as a linear relationship where the inverted-U is expected. A strong answer earns marks for these points. Identify the variables on the x-axis and y-axis of the graph. Describe the overall trend shown, such as increase, decrease, plateau or inverted-U shape. Relate the trend to the relevant skill acquisition theory, for example arousal and performance or learning curves. Use the graph to support or challenge a statement about skill acquisition. A common slip: Students often read the axes incorrectly, for example confusing arousal with anxiety. Instead, check the axis label and units before interpreting the trend. Exam tip: Underline the axis labels and key features such as peak or plateau before reading the question options.
See it
Key words
Say what each word means before you turn the card.
Graph interpretation
Try answering aloud or in your head before turning the card.
Arousal and performance
Try answering aloud or in your head before turning the card.
Learning curves
Try answering aloud or in your head before turning the card.
See every definition
- Graph interpretation
- Reading the axes, identifying the trend and relating it to the theory.
- Arousal and performance
- A relationship shown by the inverted-U graph, where performance rises to an optimum arousal point, then falls as arousal continues to increase.
- Learning curves
- Curves over time that may plateau, then improve with practice, and can show rapid improvement, plateau or gradual improvement depending on the performer and task.
Label the diagram
Some boxes have lost their names. Pick the right name for each number.
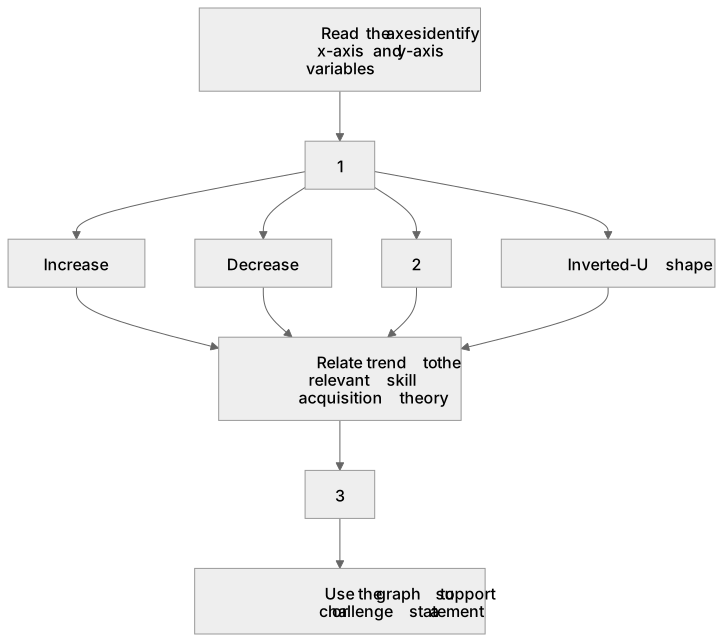
1Box 1
2Box 2
3Box 3
There is more to this lesson
The full lesson goes on to check your understanding and help you earn the marks. Create a free account to carry on, with your progress saved.
A week of Premium from your first lesson · Then the free plan continues · No card, no charge
Test your understanding of Skill acquisition: Students should be able to understand and interpret graphical representations associated with skill acquisition theories.
Active recall beats re-reading. Take an instant quiz now to test what you’ve learned and lock it into long-term memory.
A week of Premium from your first lesson · Then the free plan continues · No card, no charge