AQA · A-Level · Physical Education
Course version: 7582 · Version from Sept 2016
Students should be able to understand and interpret graphical…
Full specification wording
Sport psychology: Students should be able to understand and interpret graphical representations associated with sport psychology theories.
Graphical representations in sport psychology display relationships between psychological variables and performance or behaviour.
Checked against the AQA 7582 specification (opens in a new tab) on .
- 4 key terms
Study notes
From the checked teaching notes for this specification point.
The idea
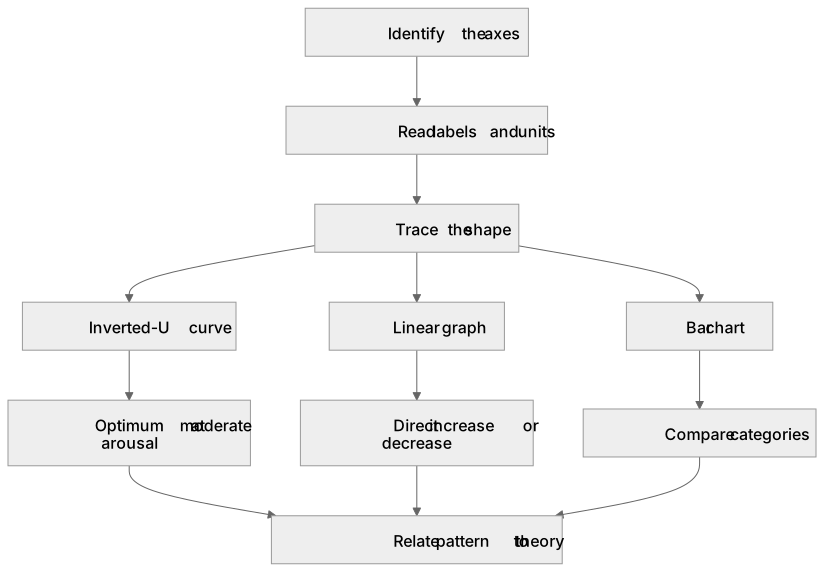
Graphical representations in sport psychology display relationships between psychological variables and performance or behaviour. To understand a graph, identify the axes: what is measured on the x-axis (for example, arousal level) and the y-axis (for example, performance quality). To interpret it, trace the shape: an inverted-U curve rises to an optimum then falls, showing moderate arousal benefiting performance; a linear graph shows a direct increase or decrease; a bar chart compares categories such as confidence levels between groups. Read the labels, units and any plotted points, then relate the pattern to the theory it represents, such as drive theory or the inverted-U hypothesis.
What earns the marks
- Identifies the variable on each axis and the direction of the relationship shown.
- Recognises the inverted-U shape as representing an optimal level of arousal for performance.
- Distinguishes a linear relationship from a curvilinear one and links each to an appropriate theory.
- Interprets plotted data points or bars to compare performance or psychological states across conditions.
- Selects the option that correctly matches the graphical pattern to the sport psychology theory it represents.
Common mistakes and how to put them right
Misreading the axes and assuming the x-axis always shows performance.
Put it right: Check each axis label and unit before interpreting the shape.
Confusing an inverted-U curve with a linear graph.
Put it right: An inverted-U rises then falls, whereas a linear graph changes at a constant rate in one direction.
Ignoring the scale or units on an axis.
Put it right: Read the numerical scale so that comparisons between points are accurate.
Assuming every graph shows cause and effect.
Put it right: A graph shows a relationship, and the theory explains why that pattern may occur.
Exam tips
- Before answering, state to yourself what each axis represents and whether the relationship is positive, negative or curvilinear.
- Look for key words in the question such as 'optimum', 'moderate' or 'linear' that point to a specific theory.
- Eliminate options that contradict the shape of the graph rather than guessing from memory.
Try the lesson
The start of the Sport psychology: Students should be able to understand and interpret graphical representations associated with sport psychology theories. lesson, made from checked teaching notes for this specification point.
Have a go first
A graph of the inverted-U theory plots arousal on the horizontal axis and performance on the vertical axis. The curve rises to a peak and then falls. What does the peak of the curve represent?
Listen
Graphical representations in sport psychology display relationships between psychological variables and performance or behaviour. To understand a graph, identify the axes: what is measured on the x-axis (for example, arousal level) and the y-axis (for example, performance quality). To interpret it, trace the shape: an inverted-U curve rises to an optimum then falls, showing moderate arousal benefiting performance; a linear graph shows a direct increase or decrease; a bar chart compares categories such as confidence levels between groups. Read the labels, units and any plotted points, then relate the pattern to the theory it represents, such as drive theory or the inverted-U hypothesis. A strong answer earns marks for these points. Identifies the variable on each axis and the direction of the relationship shown. Recognises the inverted-U shape as representing an optimal level of arousal for performance. Distinguishes a linear relationship from a curvilinear one and links each to an appropriate theory. Interprets plotted data points or bars to compare performance or psychological states across conditions. A common slip: Misreading the axes and assuming the x-axis always shows performance. Instead, check each axis label and unit before interpreting the shape. Exam tip: Before answering, state to yourself what each axis represents and whether the relationship is positive, negative or curvilinear.
See it
Key words
Say what each word means before you turn the card.
Graphical literacy in sport psychology
Try answering aloud or in your head before turning the card.
Arousal and performance relationships
Try answering aloud or in your head before turning the card.
Theory-to-graph matching
Try answering aloud or in your head before turning the card.
Data interpretation from plotted points
Try answering aloud or in your head before turning the card.
See every definition
- Graphical literacy in sport psychology
- Understanding and interpreting graphical representations associated with sport psychology theories, by identifying the axes and tracing the shape.
- Arousal and performance relationships
- An inverted-U curve rises to an optimum then falls, showing moderate arousal benefiting performance, whereas a linear graph shows a direct increase or decrease.
- Theory-to-graph matching
- Relating the pattern shown in a graph to the theory it represents, such as drive theory or the inverted-U hypothesis.
- Data interpretation from plotted points
- Reading the labels, units and any plotted points, then relating the pattern to the theory it represents.
Label the diagram
Some boxes have lost their names. Pick the right name for each number.
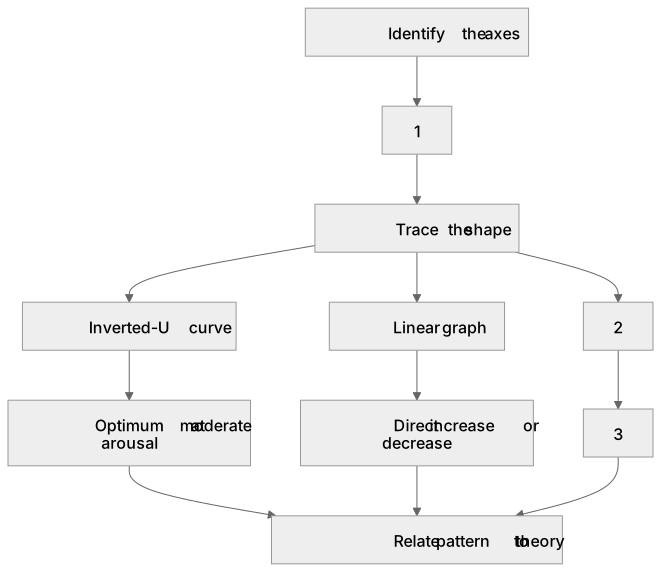
1Box 1
2Box 2
3Box 3
There is more to this lesson
The full lesson goes on to check your understanding and help you earn the marks. Create a free account to carry on, with your progress saved.
A week of Premium from your first lesson · Then the free plan continues · No card, no charge
Test your understanding of Sport psychology: Students should be able to understand and interpret graphical representations associated with sport psychology theories.
Active recall beats re-reading. Take an instant quiz now to test what you’ve learned and lock it into long-term memory.
A week of Premium from your first lesson · Then the free plan continues · No card, no charge