AQA · A-Level · Physics
Course version: 7408 · Version from Sept 2016
Use of an oscilloscope as a dc and ac voltmeter, to measure time intervals…
Full specification wording
Alternating currents (A-level only): Use of an oscilloscope as a dc and ac voltmeter, to measure time intervals and frequencies, and to display ac waveforms.
A cathode-ray oscilloscope displays how a potential difference varies with time.
Checked against the AQA 7408 specification (opens in a new tab) on .
- Point 2 of 3
- 3 key terms
Study notes
From the checked teaching notes for this specification point.
The idea
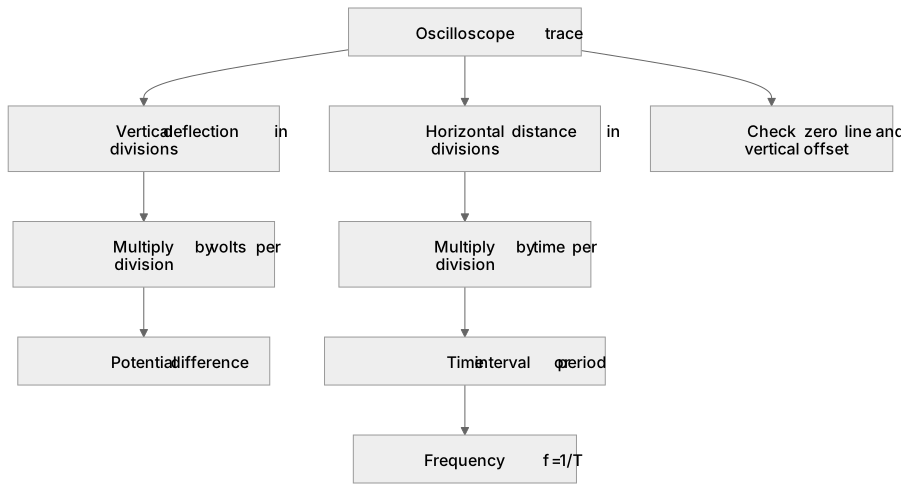
A cathode-ray oscilloscope displays how a potential difference varies with time. The electron beam sweeps horizontally at a known timebase setting, so horizontal distance represents time; the beam is deflected vertically by the input voltage, so vertical distance represents potential difference. To use it as a dc voltmeter, set the timebase to a slow sweep or off and read the steady vertical deflection, multiplying by the volts-per-division setting. For ac, a sinusoidal trace appears; its amplitude gives peak voltage and its period is the time for one complete cycle, measured in divisions and multiplied by the time-per-division setting. Frequency is the reciprocal of period, f = 1/T. Time intervals between events are found from horizontal separation. Always check the zero line and account for any vertical offset before measuring.
What earns the marks
- Identify the vertical scale in volts per division and multiply the measured vertical deflection in divisions by this value to obtain the potential difference.
- Identify the horizontal timebase in seconds (or milliseconds) per division and multiply the measured horizontal distance in divisions by this value to obtain a time interval.
- For a dc input, read the steady vertical displacement from the zero line; for an ac input, measure the amplitude from the centre line to a peak, not peak-to-peak, when asked for peak voltage.
- Measure the period as the horizontal distance for one complete cycle, then calculate frequency using f = 1/T, converting units consistently.
- Recognise that the trace is a graph of potential difference against time, so gradients and areas are not usually required at this level; the display directly encodes V and t.
- Check and state the zero position and any vertical shift control setting, because an offset changes the apparent deflection without changing the true input voltage.
Common mistakes and how to put them right
Reading peak-to-peak distance as the amplitude.
Put it right: Measure from the centre line to one peak for peak voltage, or to halve the peak-to-peak value.
Forgetting to multiply the number of divisions by the scale setting.
Put it right: Convert every measured division into volts or seconds using the relevant control value.
Using the timebase setting to convert vertical distance.
Put it right: Use volts per division vertically and time per division horizontally.
Counting a half-cycle as a full period.
Put it right: Measure between equivalent points on successive cycles, such as peak to next peak.
Exam tips
- Write the scale settings as a conversion factor before substituting numbers, for example 2.0 V div⁻¹ and 5.0 ms div⁻¹, so units cancel correctly.
- When finding frequency, convert milliseconds to seconds before taking the reciprocal, because f = 1/T requires T in seconds.
- Sketch the trace you are interpreting and label the amplitude and period on the sketch; this reduces confusion between vertical and horizontal measurements.
Try the lesson
The start of the Alternating currents (A-level only): Use of an oscilloscope as a dc and ac voltmeter, to measure time intervals and frequencies, and to display ac waveforms. lesson, made from checked teaching notes for this specification point.
Have a go first
An oscilloscope is set so that each horizontal division represents 5 ms. A steady alternating waveform completes one full cycle in 4 divisions. What is the frequency of the waveform?
Listen
A cathode-ray oscilloscope displays how a potential difference varies with time. The electron beam sweeps horizontally at a known timebase setting, so horizontal distance represents time; the beam is deflected vertically by the input voltage, so vertical distance represents potential difference. To use it as a dc voltmeter, set the timebase to a slow sweep or off and read the steady vertical deflection, multiplying by the volts-per-division setting. For ac, a sinusoidal trace appears; its amplitude gives peak voltage and its period is the time for one complete cycle, measured in divisions and multiplied by the time-per-division setting. Frequency is the reciprocal of period, f = 1/T. Time intervals between events are found from horizontal separation. Always check the zero line and account for any vertical offset before measuring. A strong answer earns marks for these points. Identify the vertical scale in volts per division and multiply the measured vertical deflection in divisions by this value to obtain the potential difference. Identify the horizontal timebase in seconds (or milliseconds) per division and multiply the measured horizontal distance in divisions by this value to obtain a time interval. For a dc input, read the steady vertical displacement from the zero line; for an ac input, measure the amplitude from the centre line to a peak, not peak-to-peak, when asked for peak voltage. Measure the period as the horizontal distance for one complete cycle, then calculate frequency using f = 1/T, converting units consistently. A common slip: Reading peak-to-peak distance as the amplitude. Instead, measure from the centre line to one peak for peak voltage, or to halve the peak-to-peak value. Exam tip: Write the scale settings as a conversion factor before substituting numbers, for example 2.0 V div⁻¹ and 5.0 ms div⁻¹, so units cancel correctly.
See it
Key words
Say what each word means before you turn the card.
Measurement and unit conversion using scale settings
Try answering aloud or in your head before turning the card.
Direct and alternating potential difference
Try answering aloud or in your head before turning the card.
Reciprocal relationship between period and frequency
Try answering aloud or in your head before turning the card.
See every definition
- Measurement and unit conversion using scale settings
- Every measured division is converted into volts or seconds using the relevant control value, with units converted consistently.
- Direct and alternating potential difference
- For a dc input the steady vertical displacement from the zero line is read, while for an ac input the amplitude is measured from the centre line to a peak.
- Reciprocal relationship between period and frequency
- Frequency is the reciprocal of period, f = 1/T, with the period measured as the horizontal distance for one complete cycle.
Label the diagram
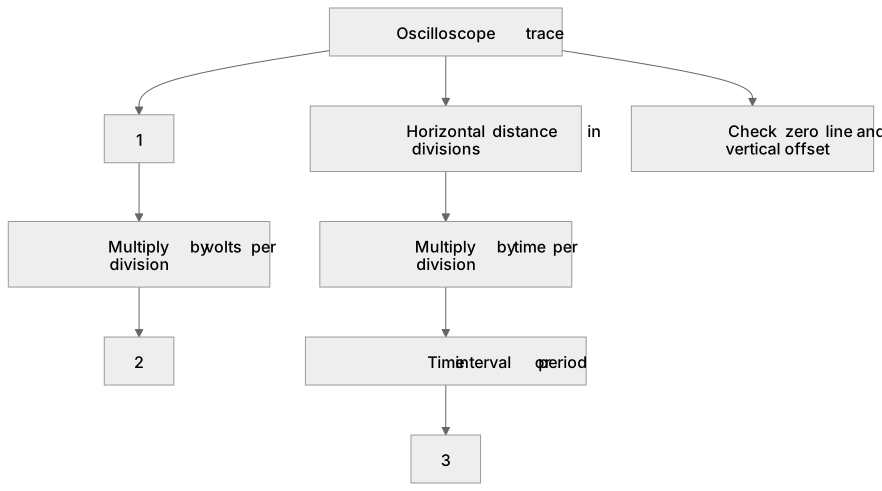
Some boxes have lost their names. Pick the right name for each number.
1Box 1
2Box 2
3Box 3
There is more to this lesson
The full lesson goes on to check your understanding and help you earn the marks. Create a free account to carry on, with your progress saved.
A week of Premium from your first lesson · Then the free plan continues · No card, no charge
Test your understanding of Alternating currents (A-level only): Use of an oscilloscope as a dc and ac voltmeter, to measure time intervals and frequencies, and to display ac waveforms.
Active recall beats re-reading. Take an instant quiz now to test what you’ve learned and lock it into long-term memory.
A week of Premium from your first lesson · Then the free plan continues · No card, no charge