AQA · A-Level · Physics
Course version: 7408 · Version from Sept 2016
Momentum: Significance of the area under a force–time graph.
The area under a force–time graph equals the impulse delivered, because impulse is the integral of force with respect to time.
Checked against the AQA 7408 specification (opens in a new tab) on .
- Point 3 of 6
- 4 key terms
Study notes
From the checked teaching notes for this specification point.
The idea
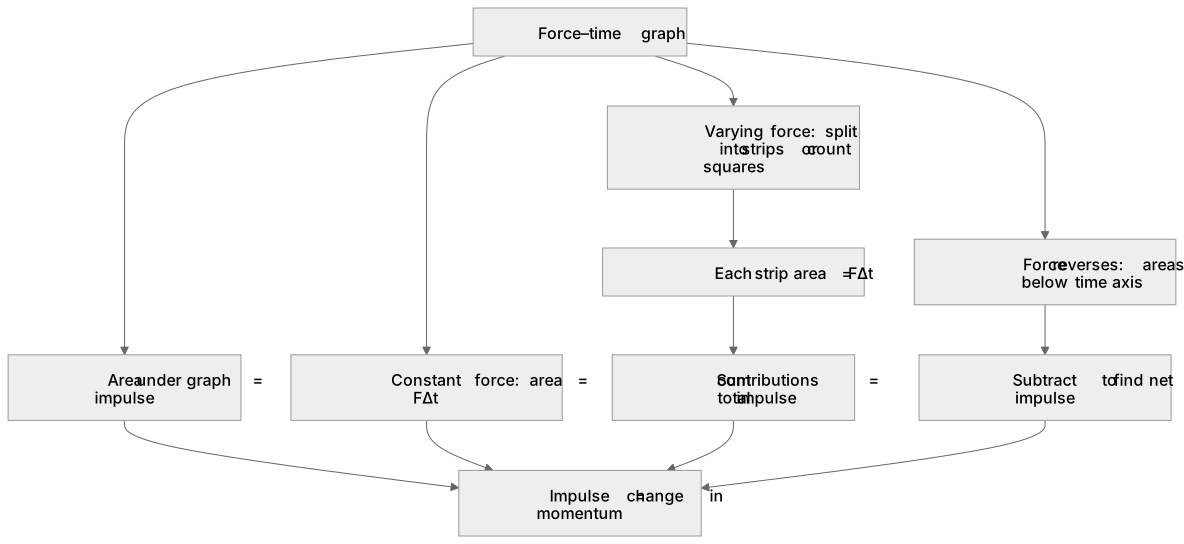
The area under a force–time graph equals the impulse delivered, because impulse is the integral of force with respect to time. For a constant force, area = FΔt, which equals the change in momentum Δp = mΔv. For a varying force, split the area into strips or count squares; each strip has area FΔt and the total is the impulse. For example, a force rising linearly from 0 N to 20 N over 0.10 s gives a triangular area of ½ × 0.10 s × 20 N = 1.0 N s, so the momentum change is 1.0 kg m s⁻¹. The area is a signed quantity if the force reverses direction, so areas below the time axis reduce the net impulse.
What earns the marks
- State that the area under a force–time graph represents impulse, and that impulse equals the change in momentum.
- For a constant force, calculate area as force × time and equate it to mΔv.
- For a varying force, divide the area into strips or count squares, then sum the contributions to find total impulse.
- Use consistent units: N s is equivalent to kg m s⁻¹, so the numerical value of the area gives the momentum change directly.
- Treat areas below the time axis as negative when finding the net impulse over a complete interaction.
Common mistakes and how to put them right
Confusing the area under a force–time graph with the area under a force–extension graph.
Put it right: The former gives impulse, while the latter gives elastic potential energy.
Using the peak force instead of the average force when the force varies, which overestimates the impulse.
Put it right by finding the average force or the true area.
Forgetting that the area gives change in momentum, not final momentum.
Put it right by adding the initial momentum vectorially when a final value is required.
Exam tips
- Sketch the graph and shade the area before calculating, so the geometric shape and any sign changes are clear.
- When the shape is a triangle or trapezium, use the standard area formulae rather than counting squares, and show the substitution with units.
- Check that the time axis is in seconds and the force axis in newtons before multiplying, converting prefixes such as ms or kN first.
Try the lesson
The start of the Momentum: Significance of the area under a force–time graph. lesson, made from checked teaching notes for this specification point.
Have a go first
A constant force of 6 N acts on a trolley for 4 s. What does the area under the force–time graph represent, and what is its value?
Listen
The area under a force–time graph equals the impulse delivered, because impulse is the integral of force with respect to time. For a constant force, area = FΔt, which equals the change in momentum Δp = mΔv. For a varying force, split the area into strips or count squares; each strip has area FΔt and the total is the impulse. For example, a force rising linearly from 0 N to 20 N over 0.10 s gives a triangular area of ½ × 0.10 s × 20 N = 1.0 N s, so the momentum change is 1.0 kg m s⁻¹. The area is a signed quantity if the force reverses direction, so areas below the time axis reduce the net impulse. A strong answer earns marks for these points. State that the area under a force–time graph represents impulse, and that impulse equals the change in momentum. For a constant force, calculate area as force × time and equate it to mΔv. For a varying force, divide the area into strips or count squares, then sum the contributions to find total impulse. Use consistent units: N s is equivalent to kg m s⁻¹, so the numerical value of the area gives the momentum change directly. A common slip: Using the peak force instead of the average force when the force varies, which overestimates the impulse. Instead, finding the average force or the true area. Exam tip: Sketch the graph and shade the area before calculating, so the geometric shape and any sign changes are clear.
See it
Key words
Say what each word means before you turn the card.
Impulse
Try answering aloud or in your head before turning the card.
Area under a force–time graph
Try answering aloud or in your head before turning the card.
Change in momentum
Try answering aloud or in your head before turning the card.
Net impulse
Try answering aloud or in your head before turning the card.
See every definition
- Impulse
- The integral of force with respect to time, equal to the area under a force–time graph and to the change in momentum.
- Area under a force–time graph
- A signed quantity representing impulse; for a constant force it is FΔt, and for a varying force it is found by splitting into strips or counting squares.
- Change in momentum
- For a constant force, mΔv, equal to the area FΔt under the force–time graph.
- Net impulse
- The total impulse over a complete interaction, found by treating areas below the time axis as negative so they reduce it.
Label the diagram
Some boxes have lost their names. Pick the right name for each number.
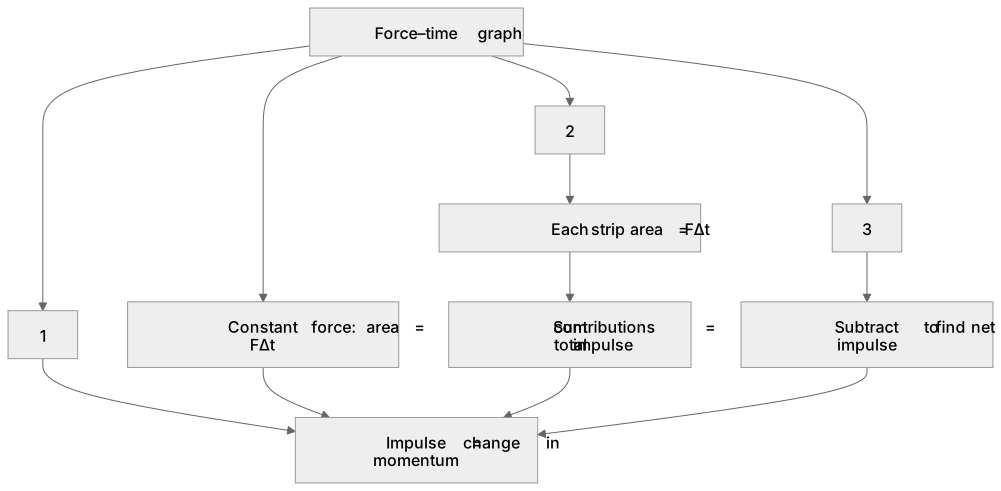
1Box 1
2Box 2
3Box 3
There is more to this lesson
The full lesson goes on to check your understanding and help you earn the marks. Create a free account to carry on, with your progress saved.
A week of Premium from your first lesson · Then the free plan continues · No card, no charge
Test your understanding of Momentum: Significance of the area under a force–time graph.
Active recall beats re-reading. Take an instant quiz now to test what you’ve learned and lock it into long-term memory.
A week of Premium from your first lesson · Then the free plan continues · No card, no charge