AQA · A-Level · Physics
Course version: 7408 · Version from Sept 2016
Quantitative questions may be set on forces that vary with time. Impact…
Full specification wording
Momentum: Quantitative questions may be set on forces that vary with time. Impact forces are related to contact times (eg kicking a football, crumple zones, packaging).
Final Result: Impulse is the area under a force–time graph; average force is impulse divided by contact time.
Checked against the AQA 7408 specification (opens in a new tab) on .
- Point 4 of 6
- 3 key terms
Study notes
From the checked teaching notes for this specification point.
The idea
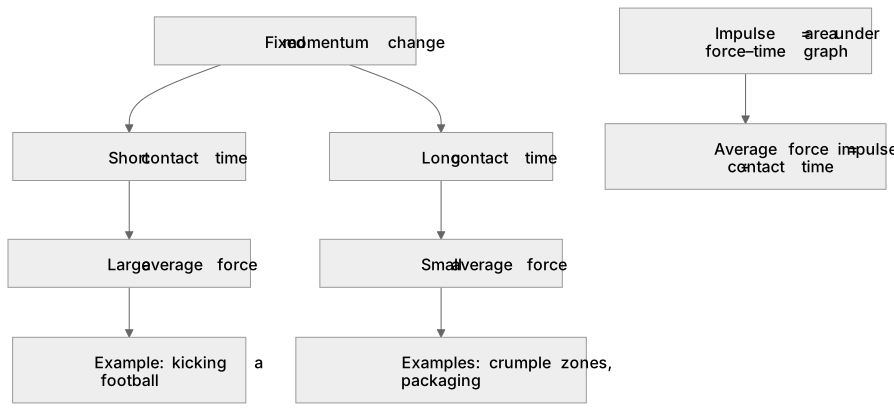
Final Result: Impulse is the area under a force–time graph; average force is impulse divided by contact time. A specific momentum change can result from a large force over a short time or a small force over a long time. For example, kicking a football involves a short contact time and large average force. Conversely, crumple zones and packaging extend collision time, reducing the average force for the same momentum change. Quantitative analysis requires reading graphs, estimating areas, and applying F_avg = Δp / Δt with consistent units (e.g., converting ms to s to avoid calculating a force 1000 times too small).
What earns the marks
- State that for a varying force the impulse is the area under the force–time graph, and that the average force equals impulse divided by contact time.
- Explain that for a fixed momentum change, increasing contact time decreases the average force, and decreasing contact time increases it.
- Apply F_avg = Δp / Δt to contexts such as a kicked ball, a crumple zone or protective packaging, converting units correctly.
- Interpret force–time graphs for impacts, identifying peak force, contact time and the area representing impulse.
- Relate safety features to reduced average force: crumple zones, airbags and packaging increase collision time and spread the force.
Common mistakes and how to put them right
Assuming the peak force equals the average force for a varying impact.
Put it right by using the area under the graph or the average value.
Using the contact time in milliseconds directly in F = Δp / Δt without converting to seconds, which gives a force a thousand times too small.
Treating the impulse as zero because the object stops.
Put it right by recognising that stopping still requires a change in momentum equal to the initial momentum.
Exam tips
- Write the impulse–momentum equation with symbols first, then substitute values with units, so the conversion of ms to s is visible.
- For graph questions, state the area method and show how the shape is divided before quoting a numerical impulse.
- Link each safety feature explicitly to increased contact time and reduced average force, using the same momentum change in both cases.
Try the lesson
The start of the Momentum: Quantitative questions may be set on forces that vary with time. Impact forces are related to contact times (eg kicking a football, crumple zones, packaging). lesson, made from checked teaching notes for this specification point.
Have a go first
A footballer kicks a stationary ball, giving it a momentum of 15 kg m/s. The foot is in contact with the ball for 0.25 s. What is the average force exerted on the ball?
Listen
Final Result: Impulse is the area under a force–time graph; average force is impulse divided by contact time. A specific momentum change can result from a large force over a short time or a small force over a long time. For example, kicking a football involves a short contact time and large average force. Conversely, crumple zones and packaging extend collision time, reducing the average force for the same momentum change. Quantitative analysis requires reading graphs, estimating areas, and applying F_avg = Δp / Δt with consistent units (e.g., converting ms to s to avoid calculating a force 1000 times too small). A strong answer earns marks for these points. State that for a varying force the impulse is the area under the force–time graph, and that the average force equals impulse divided by contact time. Explain that for a fixed momentum change, increasing contact time decreases the average force, and decreasing contact time increases it. Apply F_avg = Δp / Δt to contexts such as a kicked ball, a crumple zone or protective packaging, converting units correctly. Interpret force–time graphs for impacts, identifying peak force, contact time and the area representing impulse. A common slip: Assuming the peak force equals the average force for a varying impact. Instead, using the area under the graph or the average value. Exam tip: Write the impulse–momentum equation with symbols first, then substitute values with units, so the conversion of ms to s is visible.
See it
Key words
Say what each word means before you turn the card.
Impulse
Try answering aloud or in your head before turning the card.
Contact time
Try answering aloud or in your head before turning the card.
Crumple zones
Try answering aloud or in your head before turning the card.
See every definition
- Impulse
- For a varying force, this is the area under the force–time graph.
- Contact time
- Increasing it decreases the average force for a fixed momentum change, and decreasing it increases the average force.
- Crumple zones
- Safety features that extend collision time, reducing the average force for the same momentum change.
Label the diagram
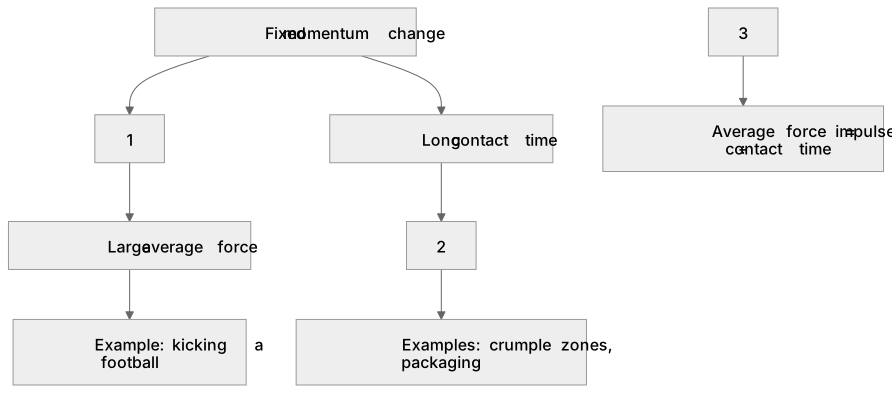
Some boxes have lost their names. Pick the right name for each number.
1Box 1
2Box 2
3Box 3
There is more to this lesson
The full lesson goes on to check your understanding and help you earn the marks. Create a free account to carry on, with your progress saved.
A week of Premium from your first lesson · Then the free plan continues · No card, no charge
Test your understanding of Momentum: Quantitative questions may be set on forces that vary with time. Impact forces are related to contact times (eg kicking a football, crumple zones, packaging).
Active recall beats re-reading. Take an instant quiz now to test what you’ve learned and lock it into long-term memory.
A week of Premium from your first lesson · Then the free plan continues · No card, no charge