AQA · A-Level · Physics
Course version: 7408 · Version from Sept 2016
Significance of areas of velocity–time and acceleration– time graphs and…
Full specification wording
Motion along a straight line: Significance of areas of velocity–time and acceleration– time graphs and gradients of displacement–time and velocity–time graphs for uniform and non-uniform acceleration eg graphs for motion of bouncing ball.
Graphs link motion variables through gradients and areas.
Checked against the AQA 7408 specification (opens in a new tab) on .
- Point 3 of 4
- 4 key terms
Study notes
From the checked teaching notes for this specification point.
The idea
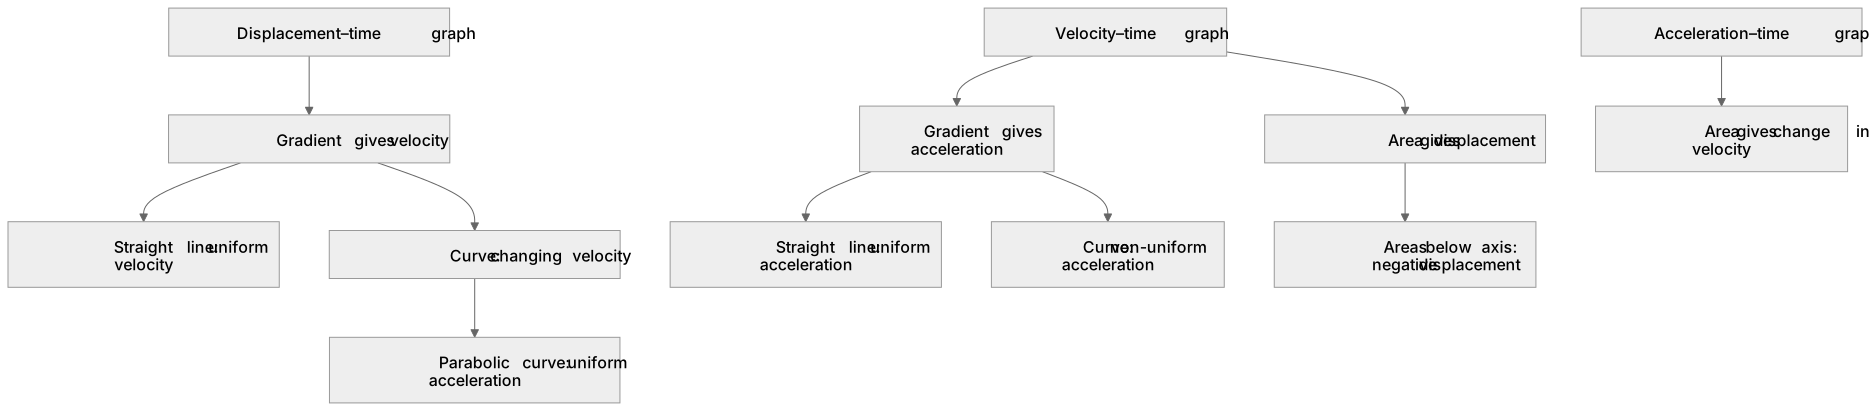
Graphs link motion variables through gradients and areas. On a displacement–time graph, the gradient gives velocity; a straight line means uniform velocity, while a curve means changing velocity. A parabolic curve indicates uniform acceleration. On a velocity–time graph, the gradient gives acceleration and the area between the line and the time axis gives displacement. Uniform acceleration yields a straight line, whereas non-uniform acceleration yields a curve. On an acceleration–time graph, the area gives the change in velocity. For a bouncing ball, each bounce shows a steep velocity change at impact, then a straight-line segment with a constant gradient as it moves under gravity, with decreasing peak speeds and shorter times between bounces.
What earns the marks
- Gradient of a displacement–time graph equals velocity (m s⁻¹); a straight line indicates uniform velocity, while a curve indicates changing velocity (a parabolic curve represents uniform acceleration).
- Gradient of a velocity–time graph equals acceleration; a straight line indicates uniform acceleration, while a curve indicates non-uniform acceleration.
- Area under a velocity–time graph equals displacement; areas below the time axis represent negative displacement, which must be subtracted from positive areas to find net displacement.
- Area under an acceleration–time graph equals change in velocity.
- For a bouncing ball, the velocity–time graph shows sharp vertical changes at each impact and parallel straight-line segments between impacts, with decreasing peak speeds as energy is dissipated.
Common mistakes and how to put them right
Assuming any curved displacement–time graph means non-uniform acceleration.
Put it right: A curve simply means velocity is changing. If the curve is a perfect parabola, the acceleration is uniform.
Confusing gradient and area.
Put it right: Area under a displacement–time graph has no direct physical meaning in this context; use the gradient to find velocity.
Ignoring signs when finding displacement from a velocity–time graph.
Put it right: Areas below the time axis are negative, so subtract them from areas above the axis to find net displacement.
Using a chord instead of a tangent to find a gradient at a point on a curve.
Put it right: Draw a tangent at the point and calculate its gradient to obtain the instantaneous value.
Exam tips
- For curved graphs, draw a tangent at the required point and clearly show the coordinates you use in the gradient calculation to find instantaneous velocity or acceleration.
- When calculating areas, split the region under the graph into simple geometric shapes like triangles, rectangles or trapezia, and state each area with its sign before combining them.
Try the lesson
The start of the Motion along a straight line: Significance of areas of velocity–time and acceleration– time graphs and gradients of displacement–time and velocity–time graphs for uniform and non-uniform acceleration eg graphs for motion of bouncing ball. lesson, made from checked teaching notes for this specification point.
Have a go first
On a velocity–time graph for an object moving along a straight line, what quantity is represented by the area between the line and the time axis?
Listen
Graphs link motion variables through gradients and areas. On a displacement–time graph, the gradient gives velocity; a straight line means uniform velocity, while a curve means changing velocity. A parabolic curve indicates uniform acceleration. On a velocity–time graph, the gradient gives acceleration and the area between the line and the time axis gives displacement. Uniform acceleration yields a straight line, whereas non-uniform acceleration yields a curve. On an acceleration–time graph, the area gives the change in velocity. For a bouncing ball, each bounce shows a steep velocity change at impact, then a straight-line segment with a constant gradient as it moves under gravity, with decreasing peak speeds and shorter times between bounces. A strong answer earns marks for these points. Gradient of a displacement–time graph equals velocity (m s⁻¹); a straight line indicates uniform velocity, while a curve indicates changing velocity (a parabolic curve represents uniform acceleration). Gradient of a velocity–time graph equals acceleration; a straight line indicates uniform acceleration, while a curve indicates non-uniform acceleration. Area under a velocity–time graph equals displacement; areas below the time axis represent negative displacement, which must be subtracted from positive areas to find net displacement. Area under an acceleration–time graph equals change in velocity. A common slip: Assuming any curved displacement–time graph means non-uniform acceleration. Instead, A curve simply means velocity is changing. If the curve is a perfect parabola, the acceleration is uniform. Exam tip: For curved graphs, draw a tangent at the required point and clearly show the coordinates you use in the gradient calculation to find instantaneous velocity or acceleration.
See it
Key words
Say what each word means before you turn the card.
Gradient
Try answering aloud or in your head before turning the card.
Area under a graph
Try answering aloud or in your head before turning the card.
Uniform acceleration
Try answering aloud or in your head before turning the card.
Non-uniform acceleration
Try answering aloud or in your head before turning the card.
See every definition
- Gradient
- On a displacement–time graph it gives velocity, and on a velocity–time graph it gives acceleration.
- Area under a graph
- Under a velocity–time graph it gives displacement, and under an acceleration–time graph it gives change in velocity.
- Uniform acceleration
- Shown by a straight line on a velocity–time graph, and by a parabolic curve on a displacement–time graph.
- Non-uniform acceleration
- Shown by a curve on a velocity–time graph, where the acceleration is not constant.
Label the diagram
Some boxes have lost their names. Pick the right name for each number.
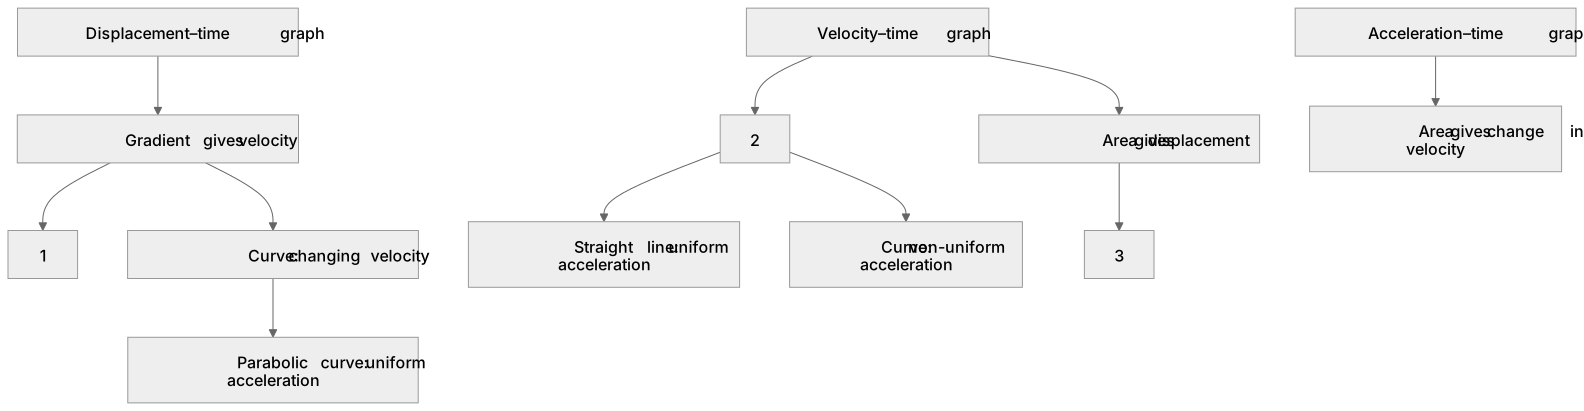
1Box 1
2Box 2
3Box 3
There is more to this lesson
The full lesson goes on to check your understanding and help you earn the marks. Create a free account to carry on, with your progress saved.
A week of Premium from your first lesson · Then the free plan continues · No card, no charge
Test your understanding of Motion along a straight line: Significance of areas of velocity–time and acceleration– time graphs and gradients of displacement–time and velocity–time graphs for uniform and non-uniform acceleration eg graphs for motion of bouncing ball.
Active recall beats re-reading. Take an instant quiz now to test what you’ve learned and lock it into long-term memory.
A week of Premium from your first lesson · Then the free plan continues · No card, no charge