OCR · A-Level · Physics
Course version: H556 · Version from Sept 2015
Analysis: (ii) measurement of gradients and intercepts.
The gradient of a graph represents the rate of change of the dependent variable with respect to the independent variable.
Checked against the OCR H556 specification (opens in a new tab) on .
- Point 5 of 5
- 3 key terms
Study notes
From the checked teaching notes for this specification point.
The idea
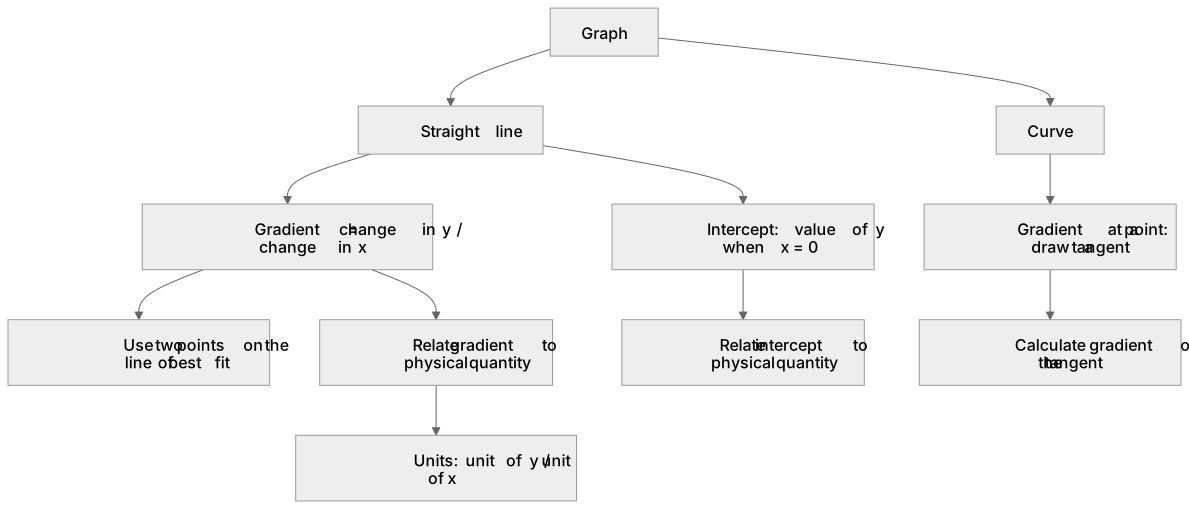
The gradient of a graph represents the rate of change of the dependent variable with respect to the independent variable. For a straight line, the gradient is calculated from the coordinates of two points on the line of best fit, using gradient = (change in y) / (change in x). The intercept is the value of the dependent variable when the independent variable is zero. For a curve, the gradient at a point is found by drawing a tangent. In experimental analysis, gradients and intercepts often correspond to physical constants or initial values.
For example: In a graph of velocity against time, the gradient gives acceleration and the intercept gives initial velocity.
What earns the marks
- Calculate the gradient of a straight line using two points on the line of best fit, applying gradient = Δy / Δx.
- Determine the intercept by reading the value where the line crosses the axis.
- For a curve, estimate the gradient at a point by drawing a tangent and calculating its gradient.
- Relate the gradient and intercept to the physical quantities in the experiment.
- Use correct units for gradient and intercept, derived from the axes.
Common mistakes and how to put them right
Misunderstanding: the gradient can be calculated using any two data points rather than points on the line of best fit.
Put it right: Use two points that lie on the line of best fit, not necessarily original data points.
Misunderstanding: the intercept is always the value where the line crosses the y-axis at x = 0.
Put it right: The intercept is the value of y when x = 0, but if the x-axis does not start at zero, the intercept may need to be extrapolated.
Misunderstanding: the gradient of a curve is constant.
Put it right: For a curve, the gradient varies; the gradient at a specific point is found by drawing a tangent at that point.
Misunderstanding: the gradient has no units.
Put it right: The gradient has units of (unit of y) / (unit of x), e.g. m/s for a velocity-time graph.
Exam tips
- When calculating a gradient, choose two points that are far apart on the line of best fit to reduce uncertainty.
- Read the intercept directly from the graph if the line crosses the axis; otherwise, extrapolate carefully.
- For a tangent, draw it as accurately as possible and use a large triangle to calculate the gradient.
- Always include the correct units for gradient and intercept in your answer.
Try the lesson
The start of the Analysis: (ii) measurement of gradients and intercepts. lesson, made from checked teaching notes for this specification point.
Listen
The gradient of a graph represents the rate of change of the dependent variable with respect to the independent variable. For a straight line, the gradient is calculated from the coordinates of two points on the line of best fit, using gradient = (change in y) / (change in x). The intercept is the value of the dependent variable when the independent variable is zero. For a curve, the gradient at a point is found by drawing a tangent. In experimental analysis, gradients and intercepts often correspond to physical constants or initial values. For example, in a graph of velocity against time, the gradient gives acceleration and the intercept gives initial velocity. A strong answer earns marks for these points. Calculate the gradient of a straight line using two points on the line of best fit, applying gradient = Δy / Δx. Determine the intercept by reading the value where the line crosses the axis. For a curve, estimate the gradient at a point by drawing a tangent and calculating its gradient. Relate the gradient and intercept to the physical quantities in the experiment. A common slip: Misunderstanding: the gradient can be calculated using any two data points rather than points on the line of best fit. Instead, use two points that lie on the line of best fit, not necessarily original data points. Exam tip: When calculating a gradient, choose two points that are far apart on the line of best fit to reduce uncertainty.
See it
Key words
Say what each word means before you turn the card.
Intercept
Try answering aloud or in your head before turning the card.
Tangent
Try answering aloud or in your head before turning the card.
Physical interpretation
Try answering aloud or in your head before turning the card.
See every definition
- Intercept
- The value of the dependent variable when the independent variable is zero.
- Tangent
- A line drawn at a point on a curve, used to find the gradient at that point.
- Physical interpretation
- Relating the gradient and intercept to the physical quantities in the experiment, such as acceleration and initial velocity.
Label the diagram
Some boxes have lost their names. Pick the right name for each number.
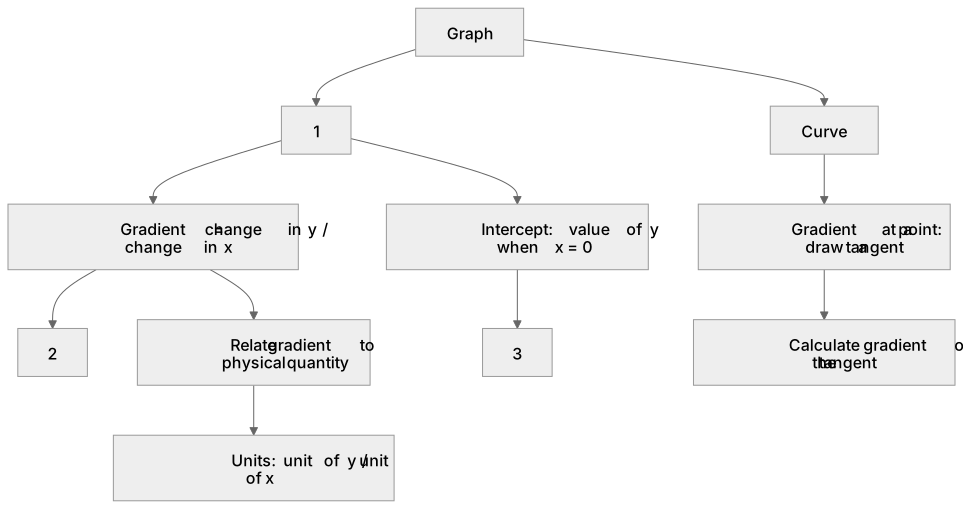
1Box 1
2Box 2
3Box 3
There is more to this lesson
The full lesson goes on to check your understanding and help you earn the marks. Create a free account to carry on, with your progress saved.
A week of Premium from your first lesson · Then the free plan continues · No card, no charge
Test your understanding of Analysis: (ii) measurement of gradients and intercepts.
Active recall beats re-reading. Take an instant quiz now to test what you’ve learned and lock it into long-term memory.
A week of Premium from your first lesson · Then the free plan continues · No card, no charge