OCR · A-Level · Physics
Course version: H556 · Version from Sept 2015
(d) graphical treatment of errors and uncertainties; line of best fit;…
Full specification wording
Measurements and uncertainties: (d) graphical treatment of errors and uncertainties; line of best fit; worst line; absolute and percentage uncertainties; percentage difference.
Graphical treatment means plotting data with error bars, then drawing a line of best fit through the points so that the trend is represented fairly.
Checked against the OCR H556 specification (opens in a new tab) on .
- Point 4 of 4
- 4 key terms
Study notes
From the checked teaching notes for this specification point.
The idea
Graphical treatment means plotting data with error bars, then drawing a line of best fit through the points so that the trend is represented fairly. A worst line is the steepest or shallowest line that still passes through every error bar; the spread between worst lines gives the uncertainty in the gradient or intercept. Absolute uncertainty carries the same unit as the quantity, for example 0.5 cm, while percentage uncertainty is the absolute uncertainty divided by the measured value, multiplied by 100, for example 0.5 cm ÷ 20.0 cm × 100 = 2.5%. Percentage difference compares an experimental value with an accepted value: difference ÷ accepted value × 100. Always label axes with quantity and unit, choose sensible scales, and state the uncertainty from the graph rather than guessing.
What earns the marks
- Error bars represent the absolute uncertainty in each plotted point and must be drawn to the scale of the axes.
- The line of best fit balances points above and below it and should pass through as many error bars as possible.
- A worst line is the steepest or shallowest straight line consistent with all error bars, giving the range of possible gradients.
- Absolute uncertainty has the same unit as the measurement; percentage uncertainty = (absolute uncertainty ÷ measured value) × 100.
- Percentage difference = (difference between experimental and accepted value ÷ accepted value) × 100.
- Gradient uncertainty can be estimated as half the difference between the steepest and shallowest worst-line gradients.
Common mistakes and how to put them right
Drawing error bars only in one direction.
Put it right: Error bars must extend both above and below each point by the stated absolute uncertainty.
Confusing percentage uncertainty with percentage difference.
Put it right: Percentage uncertainty uses the measured value as the denominator, while percentage difference uses the accepted value.
Choosing a line of best fit that passes through every point exactly.
Put it right: Real data scatter, so the line should balance the scatter rather than join points.
Forgetting to convert units before calculating a percentage.
Put it right: Both quantities in the fraction must have the same unit.
Exam tips
- Label each axis with the quantity symbol, quantity name and unit, for example time t / s, before plotting.
- When estimating gradient uncertainty, calculate the steepest and shallowest gradients from the worst lines and halve their difference.
- Check that any percentage calculation uses consistent units and quote the result to a sensible number of significant figures.
Try the lesson
The start of the Measurements and uncertainties: (d) graphical treatment of errors and uncertainties; line of best fit; worst line; absolute and percentage uncertainties; percentage difference. lesson, made from checked teaching notes for this specification point.
Listen
Graphical treatment means plotting data with error bars, then drawing a line of best fit through the points so that the trend is represented fairly. A worst line is the steepest or shallowest line that still passes through every error bar; the spread between worst lines gives the uncertainty in the gradient or intercept. Absolute uncertainty carries the same unit as the quantity, for example 0.5 cm, while percentage uncertainty is the absolute uncertainty divided by the measured value, multiplied by 100, for example 0.5 cm ÷ 20.0 cm × 100 = 2.5%. Percentage difference compares an experimental value with an accepted value: difference ÷ accepted value × 100. Always label axes with quantity and unit, choose sensible scales, and state the uncertainty from the graph rather than guessing. A strong answer earns marks for these points. Error bars represent the absolute uncertainty in each plotted point and must be drawn to the scale of the axes. The line of best fit balances points above and below it and should pass through as many error bars as possible. A worst line is the steepest or shallowest straight line consistent with all error bars, giving the range of possible gradients. Absolute uncertainty has the same unit as the measurement; percentage uncertainty = (absolute uncertainty ÷ measured value) × 100. Exam tip: Label each axis with the quantity symbol, quantity name and unit, for example time t / s, before plotting.
See it
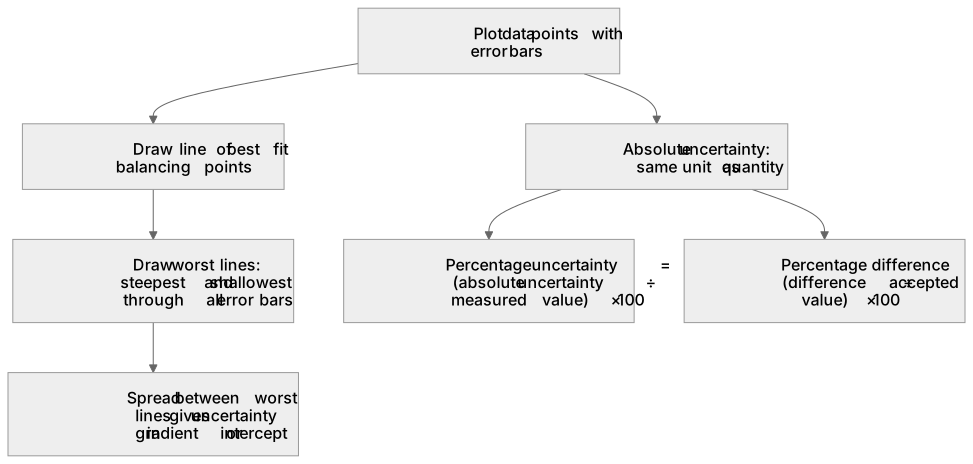
Key words
Say what each word means before you turn the card.
Graphical representation of uncertainty
Try answering aloud or in your head before turning the card.
Line of best fit and worst line
Try answering aloud or in your head before turning the card.
Absolute and percentage uncertainties
Try answering aloud or in your head before turning the card.
Percentage difference
Try answering aloud or in your head before turning the card.
See every definition
- Graphical representation of uncertainty
- Plotting data with error bars, then drawing a line of best fit through the points so that the trend is represented fairly.
- Line of best fit and worst line
- The line of best fit balances points above and below it, while a worst line is the steepest or shallowest line that still passes through every error bar.
- Absolute and percentage uncertainties
- Absolute uncertainty carries the same unit as the quantity, while percentage uncertainty is the absolute uncertainty divided by the measured value, multiplied by 100.
- Percentage difference
- A comparison of an experimental value with an accepted value: difference ÷ accepted value × 100.
Label the diagram
Some boxes have lost their names. Pick the right name for each number.
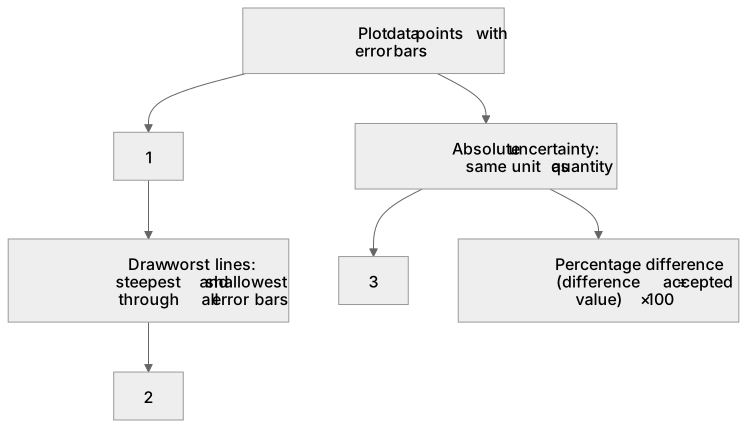
1Box 1
2Box 2
3Box 3
There is more to this lesson
The full lesson goes on to check your understanding and help you earn the marks. Create a free account to carry on, with your progress saved.
A week of Premium from your first lesson · Then the free plan continues · No card, no charge
Test your understanding of Measurements and uncertainties: (d) graphical treatment of errors and uncertainties; line of best fit; worst line; absolute and percentage uncertainties; percentage difference.
Active recall beats re-reading. Take an instant quiz now to test what you’ve learned and lock it into long-term memory.
A week of Premium from your first lesson · Then the free plan continues · No card, no charge