OCR · A-Level · Physics
Course version: H556 · Version from Sept 2015
(e) impulse is equal to the area under a force–time graph.
Full specification wording
Newton’s laws of motion: (e) impulse is equal to the area under a force–time graph.
Impulse is the product of a force and the time for which it acts, and it equals the change in momentum.
Checked against the OCR H556 specification (opens in a new tab) on .
- Point 5 of 5
- 4 key terms
Study notes
From the checked teaching notes for this specification point.
The idea
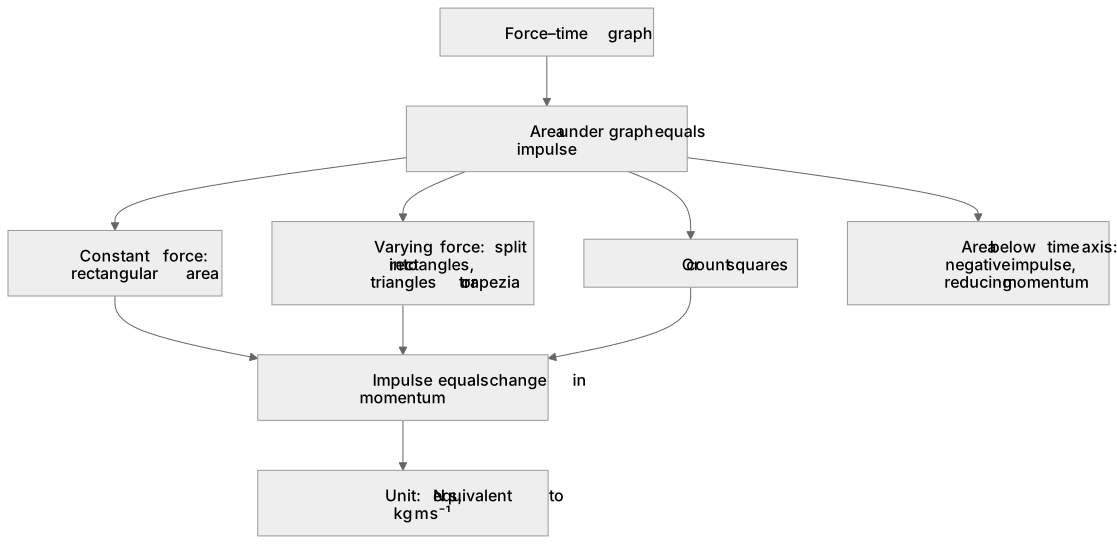
Impulse is the product of a force and the time for which it acts, and it equals the change in momentum. When the force varies, you cannot simply multiply one force value by the time. Instead, plot force on the y-axis against time on the x-axis; the area between the graph line and the time axis equals the impulse. Split the area into rectangles, triangles or trapezia, or count squares, then state the unit: N s, equivalent to kg m s⁻¹. For example, a constant 20 N for 3 s gives a rectangular area of 60 N s, so the momentum change is 60 kg m s⁻¹. A triangular spike of peak 40 N lasting 0.5 s gives area ½ × 40 × 0.5 = 10 N s.
What earns the marks
- Impulse equals force × time for a constant force, and equals the area under a force–time graph when the force varies.
- Impulse equals the change in momentum, so the area has units N s or kg m s⁻¹.
- Area below the time axis represents negative impulse, reducing momentum in the chosen positive direction.
- For a varying force, split the area into standard shapes or count squares rather than using a single force value.
Common mistakes and how to put them right
Multiplying the peak force by the total time when the force varies.
Put it right: The correct method is to find the area under the graph, which is smaller than the peak-force rectangle.
Reading the gradient of a force–time graph as impulse.
Put it right: The gradient gives the rate of change of force, while impulse is the area.
Ignoring the sign of areas below the time axis.
Put it right: The correct treatment is to subtract those areas because they represent impulse in the opposite direction.
Exam tips
- Sketch the graph and shade the area before calculating, so the shape and limits are clear.
- Convert milliseconds to seconds and grams to kilograms before finding any area.
- State the unit of impulse as N s or kg m s⁻¹ and link the numerical answer to the momentum change.
Try the lesson
The start of the Newton’s laws of motion: (e) impulse is equal to the area under a force–time graph. lesson, made from checked teaching notes for this specification point.
Listen
Impulse is the product of a force and the time for which it acts, and it equals the change in momentum. When the force varies, you cannot simply multiply one force value by the time. Instead, plot force on the y-axis against time on the x-axis; the area between the graph line and the time axis equals the impulse. Split the area into rectangles, triangles or trapezia, or count squares, then state the unit: N s, equivalent to kg m s⁻¹. For example, a constant 20 N for 3 s gives a rectangular area of 60 N s, so the momentum change is 60 kg m s⁻¹. A triangular spike of peak 40 N lasting 0.5 s gives area ½ × 40 × 0.5 = 10 N s. A strong answer earns marks for these points. Impulse equals force × time for a constant force, and equals the area under a force–time graph when the force varies. Impulse equals the change in momentum, so the area has units N s or kg m s⁻¹. Area below the time axis represents negative impulse, reducing momentum in the chosen positive direction. For a varying force, split the area into standard shapes or count squares rather than using a single force value. Exam tip: Sketch the graph and shade the area before calculating, so the shape and limits are clear.
See it
Key words
Say what each word means before you turn the card.
Force–time graphs
Try answering aloud or in your head before turning the card.
Impulse and momentum change
Try answering aloud or in your head before turning the card.
Area under a graph
Try answering aloud or in your head before turning the card.
Sign conventions in one dimension
Try answering aloud or in your head before turning the card.
See every definition
- Force–time graphs
- A plot of force on the y-axis against time on the x-axis, where the area between the graph line and the time axis equals the impulse.
- Impulse and momentum change
- Impulse equals the change in momentum, so the area under a force–time graph has units N s or kg m s⁻¹.
- Area under a graph
- For a varying force, split the area into rectangles, triangles or trapezia, or count squares, rather than using a single force value.
- Sign conventions in one dimension
- Area below the time axis represents negative impulse, reducing momentum in the chosen positive direction, so those areas are subtracted.
Label the diagram
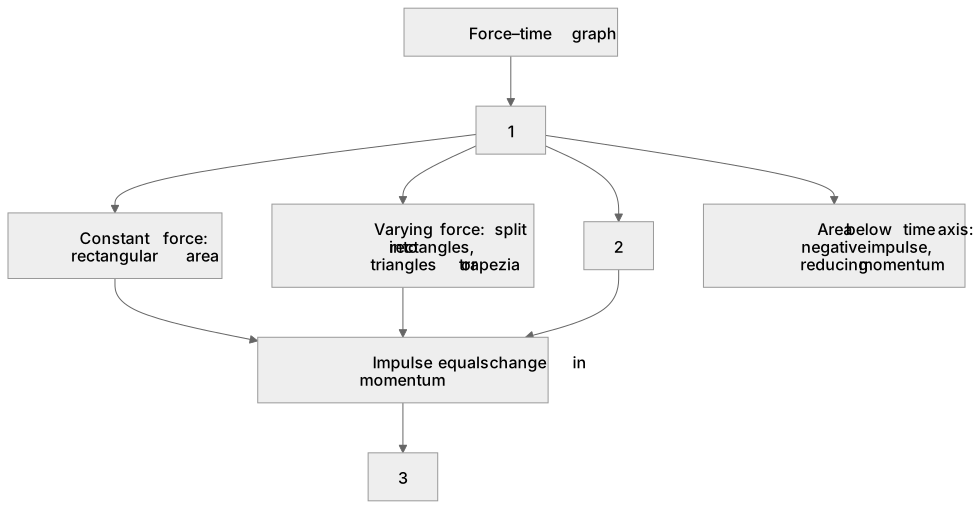
Some boxes have lost their names. Pick the right name for each number.
1Box 1
2Box 2
3Box 3
There is more to this lesson
The full lesson goes on to check your understanding and help you earn the marks. Create a free account to carry on, with your progress saved.
A week of Premium from your first lesson · Then the free plan continues · No card, no charge
Test your understanding of Newton’s laws of motion: (e) impulse is equal to the area under a force–time graph.
Active recall beats re-reading. Take an instant quiz now to test what you’ve learned and lock it into long-term memory.
A week of Premium from your first lesson · Then the free plan continues · No card, no charge