AQA · A-Level · Psychology
Course version: 7182-2025 · Exams from 2027
Estimate results (to include: commenting on the spread of scores for a set…
Full specification wording
Arithmetic and numerical computation: Estimate results (to include: commenting on the spread of scores for a set of data, which would require estimating the range)
Estimating is a checking skill rather than a shortcut.
Checked against the AQA 7182-2025 specification (opens in a new tab) on .
- Point 3 of 3
- 4 key terms
Study notes
From the checked teaching notes for this specification point.
The idea
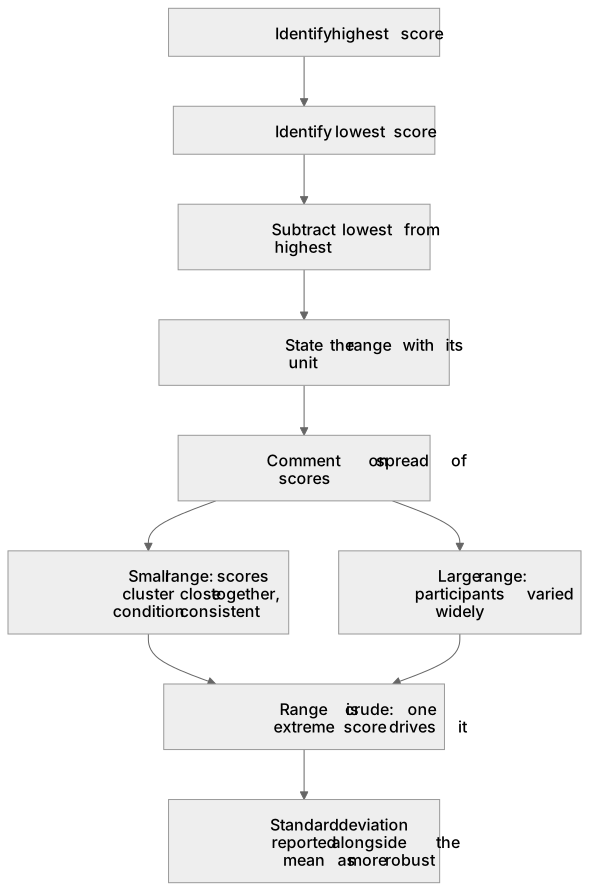
Estimating is a checking skill rather than a shortcut. Round the numbers in a table to something convenient, do the arithmetic in your head, and use the approximate answer to judge whether a calculated figure is plausible, because a mean that falls outside the highest and lowest scores has to be wrong. Dispersion is where examiners ask for this most often: take the largest score and the smallest, subtract, and you have a quick measure of how variable a condition was, so times running from 7 up to 42 seconds vary by about 35 seconds. That measure is crude, since a single extreme score drives it, which is why standard deviation is the figure a researcher reports alongside the mean.
What earns the marks
- Estimating results as a plausibility check: rounding raw data to convenient numbers to mentally calculate an approximate mean or total.
- Estimating the range to comment on the spread of scores: identifying the highest and lowest values in a data set and subtracting them.
- The range stated as a method: the highest score minus the lowest score, written with its unit, so 42 seconds minus 7 seconds is 35 seconds.
- Interpreting the figures rather than only producing them: a small estimated range means scores cluster close together and the condition was consistent, while a large one means participants varied widely.
- Understanding why standard deviation is reported: while the range is easily estimated, standard deviation uses all scores and is not easily calculated mentally, making it a more robust measure of dispersion.
Common mistakes and how to put them right
Quoting the two end scores, 7 and 42, as the answer instead of the single value 35, or calling the range a measure of central tendency when it measures dispersion.
Treating two sets with the same range as equally variable, when one outlier has inflated a range that hides tightly clustered scores.
Estimating where the stem says calculate.
Put it right: An approximate figure earns nothing when an exact value is asked for, and a calculated value with no working earns nothing if it is wrong.
Attempting to calculate the standard deviation in an exam when only an estimate of the range or a comment on the spread is required.
Exam tips
- The wording is usually briefly outline what the range tells the researcher about these data. Answer about variability and consistency, never about the average.
- Quote figures from the table when asked to comment on the results: name the condition with the wider spread, give both values, and tie the comparison back to the hypothesis.
- Estimating from a graph counts too. Read the highest and lowest points off the vertical axis, subtract, and state the scale units in the answer.
Try the lesson
The start of the Arithmetic and numerical computation: Estimate results (to include: commenting on the spread of scores for a set of data, which would require estimating the range) lesson, made from checked teaching notes for this specification point.
Have a go first
A psychologist records the reaction times (in milliseconds) of participants in a computer task. The highest recorded time is 784 ms and the lowest is 215 ms. By rounding each value to one significant figure, what is the estimated range of the reaction times?
Listen
Estimating is a checking skill rather than a shortcut. Round the numbers in a table to something convenient, do the arithmetic in your head, and use the approximate answer to judge whether a calculated figure is plausible, because a mean that falls outside the highest and lowest scores has to be wrong. Dispersion is where examiners ask for this most often: take the largest score and the smallest, subtract, and you have a quick measure of how variable a condition was, so times running from 7 up to 42 seconds vary by about 35 seconds. That measure is crude, since a single extreme score drives it, which is why standard deviation is the figure a researcher reports alongside the mean. A strong answer earns marks for these points. Estimating results as a plausibility check: rounding raw data to convenient numbers to mentally calculate an approximate mean or total. Estimating the range to comment on the spread of scores: identifying the highest and lowest values in a data set and subtracting them. The range stated as a method: the highest score minus the lowest score, written with its unit, so 42 seconds minus 7 seconds is 35 seconds. Interpreting the figures rather than only producing them: a small estimated range means scores cluster close together and the condition was consistent, while a large one means participants varied widely. Exam tip: The wording is usually briefly outline what the range tells the researcher about these data. Answer about variability and consistency, never about the average.
See it
Key words
Say what each word means before you turn the card.
Estimating results
Try answering aloud or in your head before turning the card.
Range
Try answering aloud or in your head before turning the card.
Spread of scores
Try answering aloud or in your head before turning the card.
Standard deviation
Try answering aloud or in your head before turning the card.
See every definition
- Estimating results
- Rounding raw data to convenient numbers to mentally calculate an approximate mean or total, used as a plausibility check.
- Range
- The highest score minus the lowest score, written with its unit, giving a quick measure of how variable a condition was.
- Spread of scores
- How variable a condition was, commented on by estimating the range, where a small range means scores cluster close together.
- Standard deviation
- A measure of dispersion that uses all scores and is not easily calculated mentally, making it more robust than the range.
Label the diagram
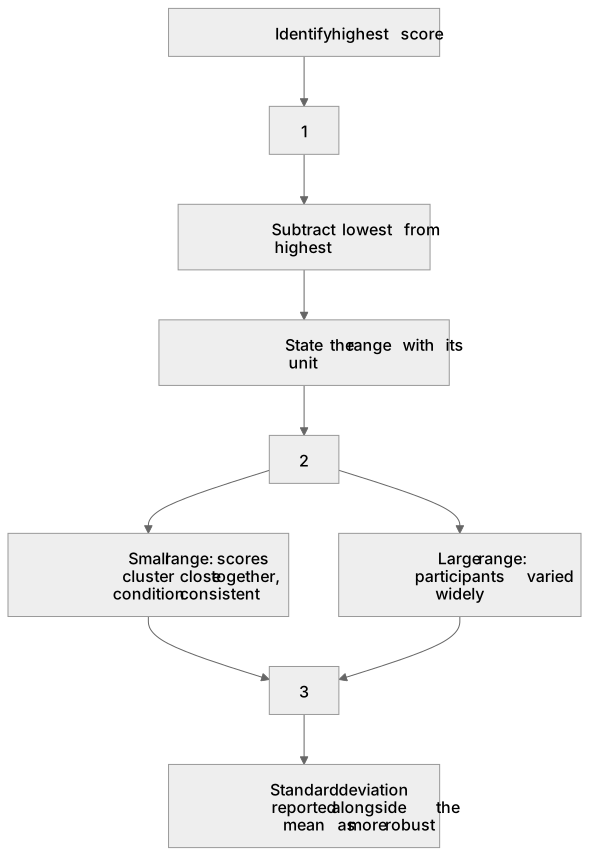
Some boxes have lost their names. Pick the right name for each number.
1Box 1
2Box 2
3Box 3
There is more to this lesson
The full lesson goes on to check your understanding and help you earn the marks. Create a free account to carry on, with your progress saved.
A week of Premium from your first lesson · Then the free plan continues · No card, no charge
Test your understanding of Arithmetic and numerical computation: Estimate results (to include: commenting on the spread of scores for a set of data, which would require estimating the range)
Active recall beats re-reading. Take an instant quiz now to test what you’ve learned and lock it into long-term memory.
A week of Premium from your first lesson · Then the free plan continues · No card, no charge