AQA · A-Level · Psychology
Course version: 7182-2025 · Exams from 2027
Recognise and use expressions in decimal and standard form (to include:…
Full specification wording
Arithmetic and numerical computation: Recognise and use expressions in decimal and standard form (to include: converting data in standard form from a results table into decimal form in order to construct a pie chart)
Psychology papers print very small and very large numbers compactly, so a reaction time, a hormone concentration or a probability from a computer printout often arrives as a coefficient between…
Checked against the AQA 7182-2025 specification (opens in a new tab) on .
- Point 1 of 3
- 4 key terms
Study notes
From the checked teaching notes for this specification point.
The idea
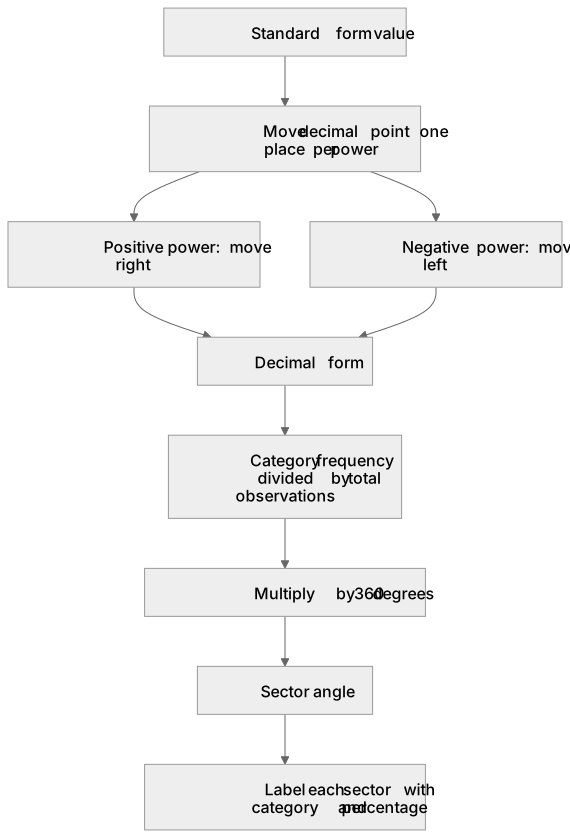
Psychology papers print very small and very large numbers compactly, so a reaction time, a hormone concentration or a probability from a computer printout often arrives as a coefficient between one and ten multiplied by a power of ten. To read it, move the decimal point once for every power, to the right for a positive power and to the left for a negative one, so 2.5 times ten to the power of minus three seconds is 0.0025 seconds. That skill is examined in two familiar places. A probability has to be compared against the five percent significance level before a result can be called significant, and a graph has to be drawn from plain frequencies: divide each category total by the grand total, multiply by 360, and label every sector with its category and its percentage.
What earns the marks
- Turning frequencies into sector angles: the frequency in a category, divided by the total number of observations, multiplied by 360 degrees, with the sectors summing to 360 degrees and each one labelled.
Common mistakes and how to put them right
Moving the decimal point the wrong way for a negative power, so 3.0 times ten to the power of minus two is written as 300 instead of 0.03, which makes a fast reaction time look enormous.
Reading a probability of 5.0 times ten to the power of minus four as bigger than 0.05 because the coefficient looks bigger, then wrongly retaining the null hypothesis when the result was in fact significant.
Writing a coefficient that is not between one and ten, such as 25 times ten to the power of three in place of 2.5 times ten to the power of four.
Drawing the pie chart from percentages that do not total one hundred, or leaving the sectors unlabelled, which loses the display marks however accurate the arithmetic was.
Exam tips
- Expect standard-form values inside a Research Methods results table; convert them carefully before drawing or interpreting the requested display.
- Show the working. A calculation mark is often available for the division and the multiplication even when the final figure is wrong, and an answer with no working scores nothing if it is wrong.
- Give the answer to the accuracy the stem demands and keep the unit, so write 0.03 seconds when two decimal places are asked for, and do not round until the final step.
- If the data are two co variables rather than categories, the display is a scattergram and the test is Spearman's rho, where the observed value of rho must be equal to or greater than the critical value at p less than or equal to 0.05 for that number of pairs.
Try the lesson
The start of the Arithmetic and numerical computation: Recognise and use expressions in decimal and standard form (to include: converting data in standard form from a results table into decimal form in order to construct a pie chart) lesson, made from checked teaching notes for this specification point.
Have a go first
A psychologist records the reaction times of participants in milliseconds. One participant's reaction time is recorded as 3.45 × 10² milliseconds. What is this value expressed in decimal form?
Listen
Psychology papers print very small and very large numbers compactly, so a reaction time, a hormone concentration or a probability from a computer printout often arrives as a coefficient between one and ten multiplied by a power of ten. To read it, move the decimal point once for every power, to the right for a positive power and to the left for a negative one, so 2.5 times ten to the power of minus three seconds is 0.0025 seconds. That skill is examined in two familiar places. A probability has to be compared against the five percent significance level before a result can be called significant, and a graph has to be drawn from plain frequencies: divide each category total by the grand total, multiply by 360, and label every sector with its category and its percentage. A strong answer earns marks for these points. Reading the notation correctly: the coefficient is a number between one and ten, and the power of ten counts the places the decimal point moves, right for a positive power and left for a negative one, so 2.5 times ten to the power of minus three becomes 0.0025. Putting a whole results table into the same decimal form before any comparison, because 4.0 times ten to the power of minus two is larger than 8.0 times ten to the power of minus three even though the coefficient looks smaller. Turning frequencies into sector angles: the frequency in a category, divided by the total number of observations, multiplied by 360 degrees, with the sectors summing to 360 degrees and each one labelled. Judging a probability written this way against the accepted level of significance, so a value of 1.2 times ten to the power of minus four is smaller than 0.05, the null hypothesis is rejected and the difference is described as significant. Exam tip: Expect standard-form values inside a Research Methods results table; convert them carefully before drawing or interpreting the requested display.
See it
Key words
Say what each word means before you turn the card.
standard form notation
Try answering aloud or in your head before turning the card.
decimal conversion
Try answering aloud or in your head before turning the card.
pie chart construction
Try answering aloud or in your head before turning the card.
probability and significance level
Try answering aloud or in your head before turning the card.
See every definition
- standard form notation
- A coefficient between one and ten multiplied by a power of ten, where the power counts the places the decimal point moves.
- decimal conversion
- Moving the decimal point once for every power, to the right for a positive power and to the left for a negative one.
- pie chart construction
- Dividing each category total by the grand total, multiplying by 360, and labelling every sector with its category and its percentage.
- probability and significance level
- A probability compared against the five percent significance level before a result can be called significant.
Label the diagram
Some boxes have lost their names. Pick the right name for each number.
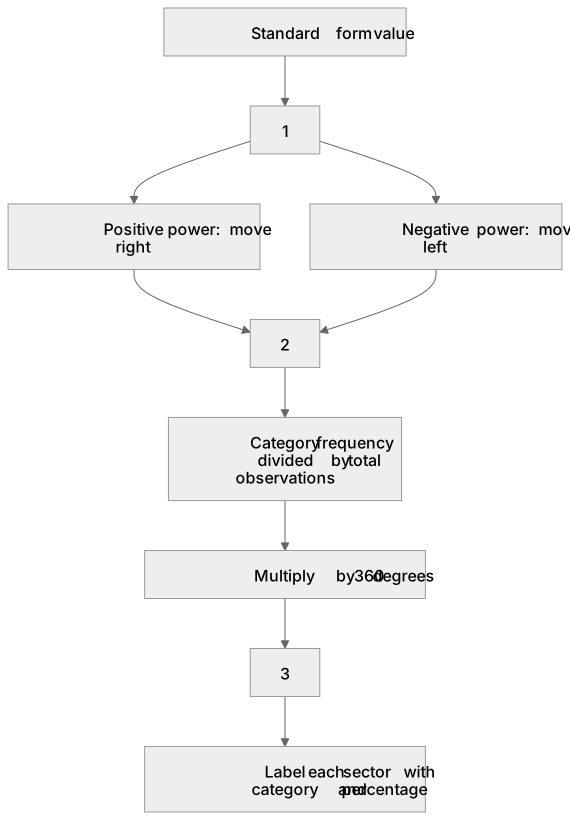
1Box 1
2Box 2
3Box 3
There is more to this lesson
The full lesson goes on to check your understanding and help you earn the marks. Create a free account to carry on, with your progress saved.
A week of Premium from your first lesson · Then the free plan continues · No card, no charge
Test your understanding of Arithmetic and numerical computation: Recognise and use expressions in decimal and standard form (to include: converting data in standard form from a results table into decimal form in order to construct a pie chart)
Active recall beats re-reading. Take an instant quiz now to test what you’ve learned and lock it into long-term memory.
A week of Premium from your first lesson · Then the free plan continues · No card, no charge