AQA · A-Level · Psychology
Course version: 7182-2025 · Exams from 2027
Presentation and display of quantitative data: graphs, tables,…
Full specification wording
Data handling and analysis: Presentation and display of quantitative data: graphs, tables, scattergrams, bar charts, histograms.
A table in a report is not a list of raw scores; it is a summary, giving the descriptive statistics for each condition under a title that names the variables and the units.
Checked against the AQA 7182-2025 specification (opens in a new tab) on .
- Point 4 of 8
- 4 key terms
Study notes
From the checked teaching notes for this specification point.
The idea
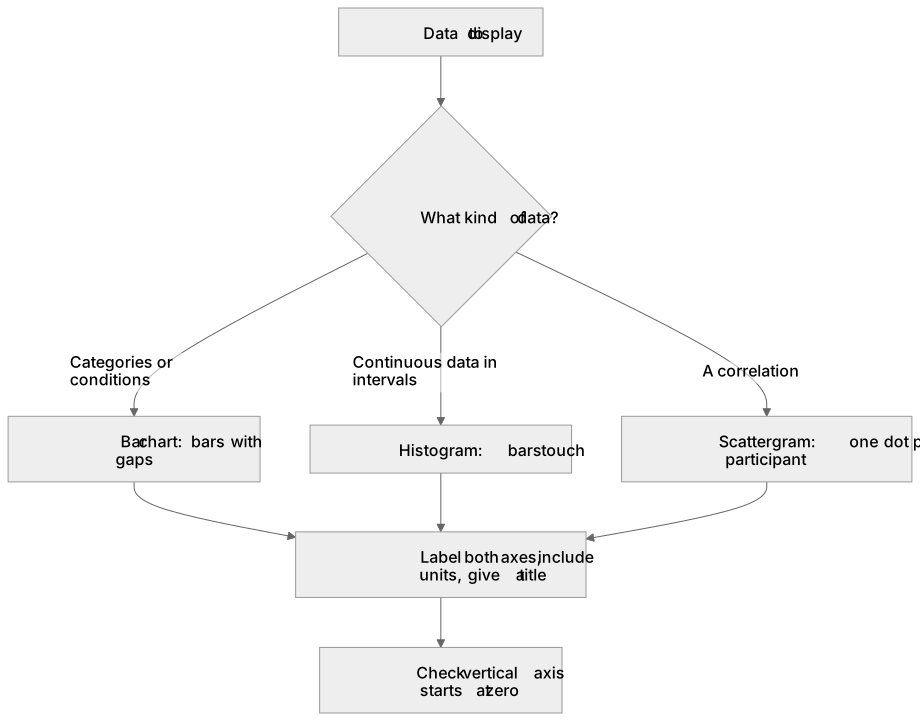
A table in a report is not a list of raw scores; it is a summary, giving the descriptive statistics for each condition under a title that names the variables and the units. Bar charts display data in categories or conditions, and their bars carry gaps because there is no continuous scale along the bottom, while the vertical axis shows frequency or a mean. Histograms display continuous data, so the bars touch, the horizontal axis is divided into equal intervals and no interval is skipped. A scattergram displays a correlation: one co-variable on each axis, one dot per participant, and the shape of the cloud tells you direction and strength. Label both axes and give a title every time. Watch for a vertical axis that does not begin at zero, which makes a trivial difference look dramatic.
What earns the marks
- Choosing the right display for the data: bar chart for categories or conditions, histogram for continuous data grouped into intervals, scattergram for a correlation.
- Gaps between the bars of a bar chart because the categories are discrete, and touching bars on a histogram because the underlying scale is continuous.
- A summary table presents descriptive statistics rather than raw data, and is read with a sentence saying what it shows.
- Reading a scattergram: an upward pattern is a positive correlation, a downward pattern negative, and a formless scatter of points a zero correlation.
- Evaluation: a graph can mislead, for instance where the vertical axis does not start at zero, so an apparently large difference may be trivial.
Common mistakes and how to put them right
Drawing a bar chart with touching bars, or a histogram with gaps, which forfeits the mark that distinguishes the two.
Plotting two means as a bar chart when the stem describes a correlation, which needs a scattergram.
Leaving the axes unlabelled, which is the most commonly lost mark on any drawing item.
Copying every participant's raw score into what the question called a summary table.
Exam tips
- Read the level of measurement in the stem before choosing the graph; categories mean a bar chart whatever the study is about.
- 'Sketch' still requires labelled axes and a title, but the plotting need not be to scale.
- When asked what a graph shows, describe the pattern using the stem's variables rather than saying one bar is taller than another.
Try the lesson
The start of the Data handling and analysis: Presentation and display of quantitative data: graphs, tables, scattergrams, bar charts, histograms. lesson, made from checked teaching notes for this specification point.
Have a go first
A psychologist has collected data on the number of participants who chose each of four different colours. Which type of graph is most appropriate to display this discrete categorical data?
Listen
A table in a report is not a list of raw scores; it is a summary, giving the descriptive statistics for each condition under a title that names the variables and the units. Bar charts display data in categories or conditions, and their bars carry gaps because there is no continuous scale along the bottom, while the vertical axis shows frequency or a mean. Histograms display continuous data, so the bars touch, the horizontal axis is divided into equal intervals and no interval is skipped. A scattergram displays a correlation: one co-variable on each axis, one dot per participant, and the shape of the cloud tells you direction and strength. Label both axes and give a title every time. Watch for a vertical axis that does not begin at zero, which makes a trivial difference look dramatic. A strong answer earns marks for these points. Choosing the right display for the data: bar chart for categories or conditions, histogram for continuous data grouped into intervals, scattergram for a correlation. Gaps between the bars of a bar chart because the categories are discrete, and touching bars on a histogram because the underlying scale is continuous. A summary table presents descriptive statistics rather than raw data, and is read with a sentence saying what it shows. Reading a scattergram: an upward pattern is a positive correlation, a downward pattern negative, and a formless scatter of points a zero correlation. Exam tip: Read the level of measurement in the stem before choosing the graph; categories mean a bar chart whatever the study is about.
See it
Key words
Say what each word means before you turn the card.
Bar charts
Try answering aloud or in your head before turning the card.
Histograms
Try answering aloud or in your head before turning the card.
Scattergrams
Try answering aloud or in your head before turning the card.
Misleading presentation
Try answering aloud or in your head before turning the card.
See every definition
- Bar charts
- Display data in categories or conditions, with gaps between the bars because there is no continuous scale along the bottom.
- Histograms
- Display continuous data, so the bars touch, the horizontal axis is divided into equal intervals and no interval is skipped.
- Scattergrams
- Display a correlation, with one co-variable on each axis, one dot per participant, and the shape of the cloud showing direction and strength.
- Misleading presentation
- A graph can mislead, for instance where the vertical axis does not begin at zero, making a trivial difference look dramatic.
There is more to this lesson
The full lesson goes on to check your understanding and help you earn the marks. Create a free account to carry on, with your progress saved.
A week of Premium from your first lesson · Then the free plan continues · No card, no charge
Test your understanding of Data handling and analysis: Presentation and display of quantitative data: graphs, tables, scattergrams, bar charts, histograms.
Active recall beats re-reading. Take an instant quiz now to test what you’ve learned and lock it into long-term memory.
A week of Premium from your first lesson · Then the free plan continues · No card, no charge