AQA · A-Level · Psychology
Course version: 7182-2025 · Exams from 2027
Know the characteristics of normal and skewed distributions (to include:…
Full specification wording
Handling data: Know the characteristics of normal and skewed distributions (to include: being presented with a set of scores from an experiment and being asked to indicate the position of the mean (or median, or mode))
A frequency distribution is the shape a set of scores makes when the scores run along the horizontal axis and the frequency up the vertical one.
Checked against the AQA 7182-2025 specification (opens in a new tab) on .
- Point 12 of 17
- 3 key terms
Study notes
From the checked teaching notes for this specification point.
The idea
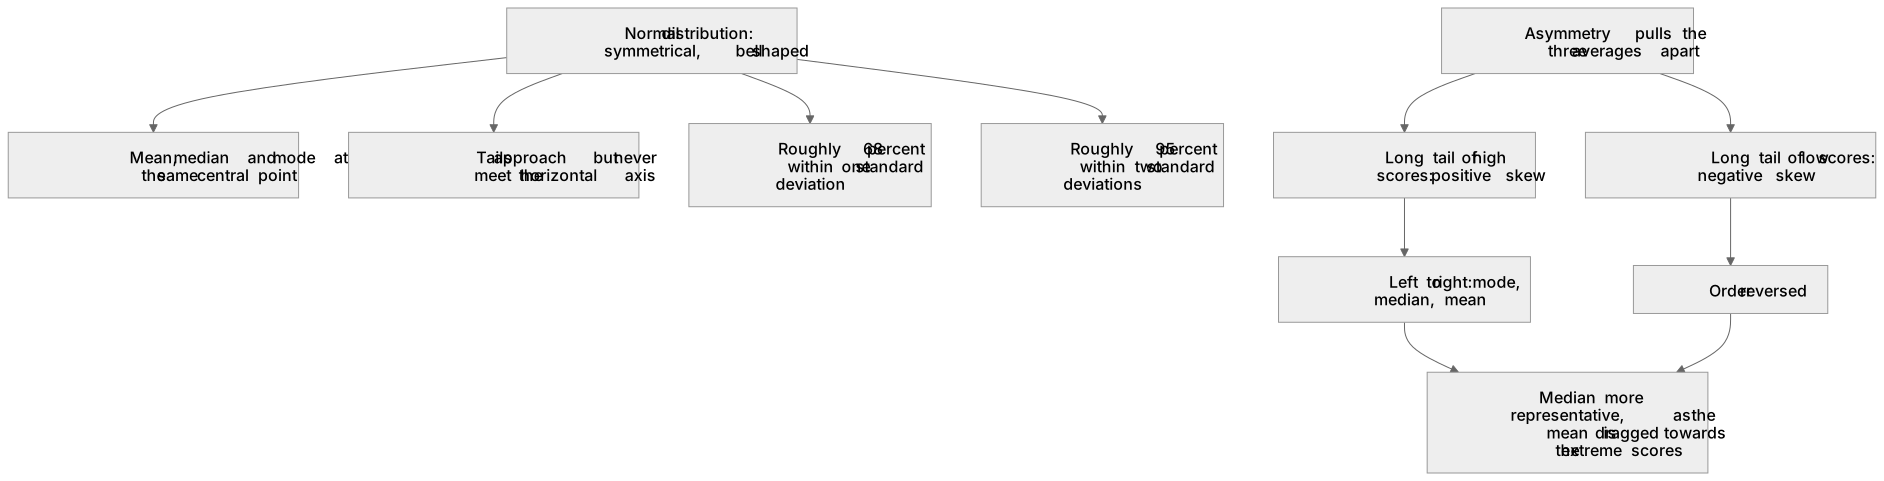
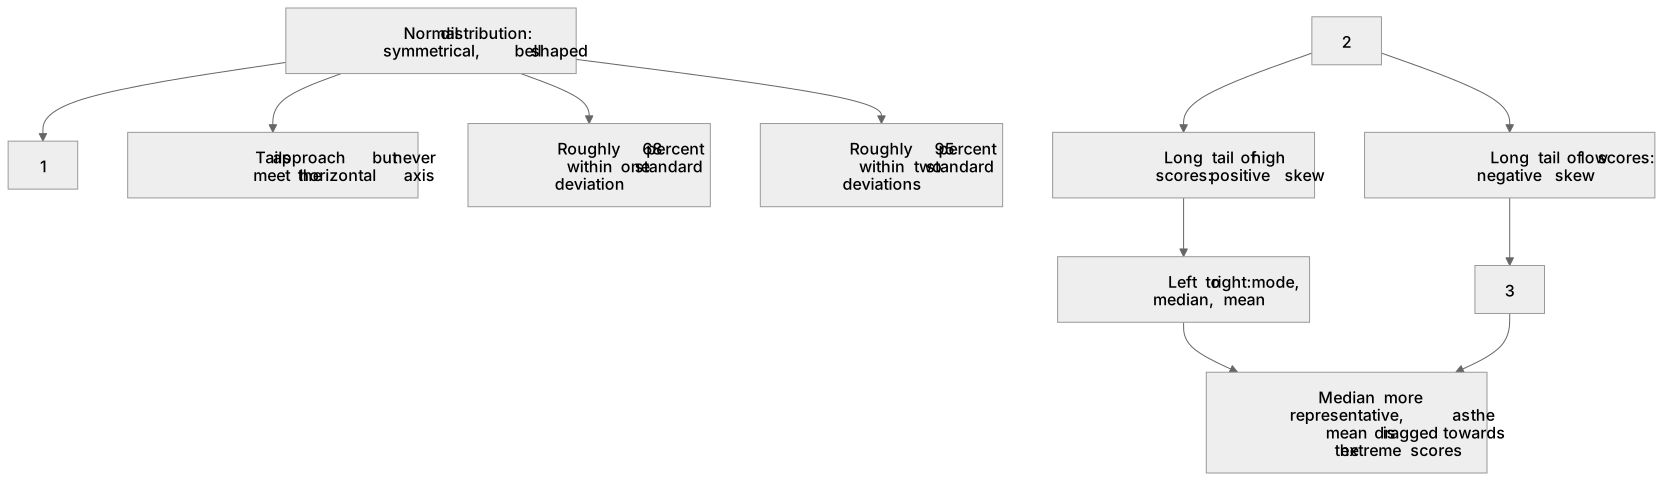
A frequency distribution is the shape a set of scores makes when the scores run along the horizontal axis and the frequency up the vertical one. The bell shaped curve is symmetrical about its centre, so the mean, the median and the mode all sit together under the peak, the tails get closer to the axis without ever touching it, and roughly 68 percent of scores fall within one standard deviation of the mean with roughly 95 percent within two. Asymmetry pulls those three averages apart. A long tail of high scores drags the mean out towards the tail and leaves the mode under the hump, so reading from left to right the order becomes mode, median, mean, and a long tail of low scores reverses that order.
What earns the marks
- Describing the normal distribution precisely: symmetrical and bell shaped, with the mean, the median and the mode at the same central point and the tails approaching but never meeting the horizontal axis.
- Placing the averages correctly on a drawn curve, so on a positively skewed curve the mode is at the peak, the median comes next and the mean lies furthest into the long right hand tail.
- Naming the skew from the tail rather than from the hump, so a long tail stretching towards the high scores is a positive skew and a long tail towards the low scores is a negative skew.
- Explaining the shape from the study, for example that a test almost everybody failed produces a positive skew because most scores bunch at the low end and only a few stretch upwards.
- Saying what follows for reporting, namely that the median is the more representative average in a skewed distribution because the mean is dragged towards the extreme scores.
Common mistakes and how to put them right
Labelling the skew by where most of the scores sit rather than by where the tail points, so a curve with the bulk of scores on the left is wrongly called negatively skewed.
Putting the mean at the peak of a skewed curve, when the peak is the mode and the mean is the average that gets pulled out towards the tail.
Writing that a normal distribution has the mean in the centre and stopping there, without adding that the median and the mode lie at the same point.
Confusing skew with dispersion, and describing a wide flat curve as skewed when it is symmetrical but simply more spread out.
Exam tips
- These marks often arrive as a diagram to annotate, with arrows to label or a curve on which you must mark the position of the mean, the median and the mode, so practise the drawing and not only the wording.
- A stem that mentions a floor effect or a ceiling effect is telling you which skew to expect, because a task that was far too hard gives a positive skew and one that was far too easy gives a negative skew.
- If asked to explain why a researcher reported the median, tie the answer to the skew and to the outlying scores rather than saying that the median is easier to find.
- Where a curve is described as normal, you can use it: say that about 68 percent of participants scored within one standard deviation of the mean when the question asks you to interpret a value.
Try the lesson
The start of the Handling data: Know the characteristics of normal and skewed distributions (to include: being presented with a set of scores from an experiment and being asked to indicate the position of the mean (or median, or mode)) lesson, made from checked teaching notes for this specification point.
Have a go first
A psychologist plots the results of a standardised reading test taken by 1000 children and observes a perfectly symmetrical, bell-shaped curve. In this specific distribution, what is the relationship between the mean, median, and mode?
Listen
A frequency distribution is the shape a set of scores makes when the scores run along the horizontal axis and the frequency up the vertical one. The bell shaped curve is symmetrical about its centre, so the mean, the median and the mode all sit together under the peak, the tails get closer to the axis without ever touching it, and roughly 68 percent of scores fall within one standard deviation of the mean with roughly 95 percent within two. Asymmetry pulls those three averages apart. A long tail of high scores drags the mean out towards the tail and leaves the mode under the hump, so reading from left to right the order becomes mode, median, mean, and a long tail of low scores reverses that order. A strong answer earns marks for these points. Describing the normal distribution precisely: symmetrical and bell shaped, with the mean, the median and the mode at the same central point and the tails approaching but never meeting the horizontal axis. Placing the averages correctly on a drawn curve, so on a positively skewed curve the mode is at the peak, the median comes next and the mean lies furthest into the long right hand tail. Naming the skew from the tail rather than from the hump, so a long tail stretching towards the high scores is a positive skew and a long tail towards the low scores is a negative skew. Explaining the shape from the study, for example that a test almost everybody failed produces a positive skew because most scores bunch at the low end and only a few stretch upwards. Exam tip: These marks often arrive as a diagram to annotate, with arrows to label or a curve on which you must mark the position of the mean, the median and the mode, so practise the drawing and not only the wording.
See it
Key words
Say what each word means before you turn the card.
normal distribution
Try answering aloud or in your head before turning the card.
positive and negative skew
Try answering aloud or in your head before turning the card.
standard deviation within a normal curve
Try answering aloud or in your head before turning the card.
See every definition
- normal distribution
- A symmetrical bell shaped curve in which the mean, the median and the mode all sit together under the peak and the tails approach but never meet the horizontal axis.
- positive and negative skew
- A long tail stretching towards the high scores is a positive skew and a long tail towards the low scores is a negative skew, named from the tail rather than the hump.
- standard deviation within a normal curve
- Roughly 68 percent of scores fall within one standard deviation of the mean and roughly 95 percent within two.
Label the diagram
Some boxes have lost their names. Pick the right name for each number.
1Box 1
2Box 2
3Box 3
There is more to this lesson
The full lesson goes on to check your understanding and help you earn the marks. Create a free account to carry on, with your progress saved.
A week of Premium from your first lesson · Then the free plan continues · No card, no charge
Test your understanding of Handling data: Know the characteristics of normal and skewed distributions (to include: being presented with a set of scores from an experiment and being asked to indicate the position of the mean (or median, or mode))
Active recall beats re-reading. Take an instant quiz now to test what you’ve learned and lock it into long-term memory.
A week of Premium from your first lesson · Then the free plan continues · No card, no charge