AQA · A-Level · Psychology
Course version: 7182-2025 · Exams from 2027
Probability and significance: use of statistical tables and critical…
Full specification wording
Inferential testing: Probability and significance: use of statistical tables and critical values in interpretation of significance; Type I and Type II errors.
Probability is the risk of being wrong that a researcher agrees in advance to run.
Checked against the AQA 7182-2025 specification (opens in a new tab) on .
- Point 3 of 4
- 4 key terms
Study notes
From the checked teaching notes for this specification point.
The idea
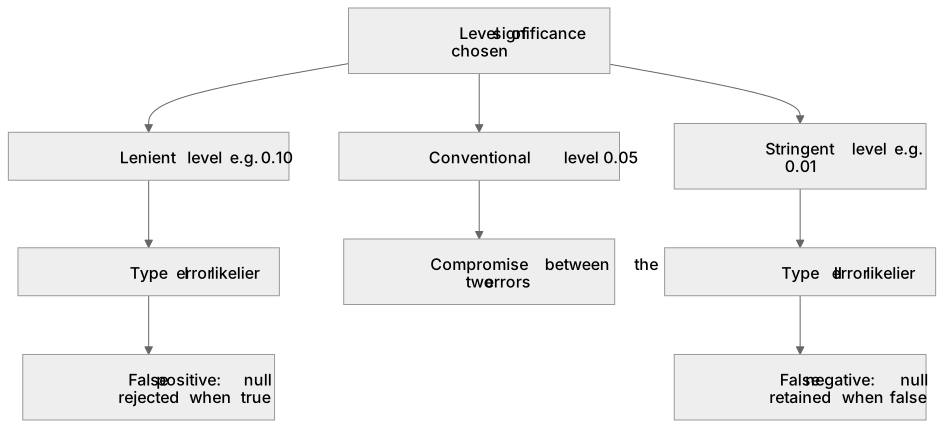
Probability is the risk of being wrong that a researcher agrees in advance to run. Psychology settles on p less than or equal to 0.05: the possibility that a result like this came about by chance is five in a hundred or fewer. Reading a table of critical values needs three pieces of information, whether the hypothesis was directional (one-tailed) or non-directional (two-tailed), the value of N or the degrees of freedom, and the level of significance, and then the rule for that test, since some require the calculated value to be smaller than the critical value and others larger. A Type I error is a false positive, rejecting a null hypothesis that was true, and gets likelier if the level is relaxed. A Type II error is a false negative, missing a real effect, and gets likelier as the level is made stricter.
What earns the marks
- The 5% level (p less than or equal to 0.05) is the conventional level of significance in psychology: no more than a five in a hundred possibility that the result is down to chance.
- Three things are needed to find a critical value in a table: N or the degrees of freedom, whether the test is one-tailed or two-tailed, and the chosen level of significance.
- For the sign test, Wilcoxon and Mann-Whitney the calculated value must be equal to or LESS than the critical value; for the t-tests, Spearman's rho, Pearson's r and chi-squared it must be equal to or GREATER.
- Type I error: the null hypothesis is rejected when it is in fact true, so an effect is claimed that does not exist (the optimistic error).
- Type II error: the null hypothesis is retained when it is in fact false, so a real effect is missed (the pessimistic error).
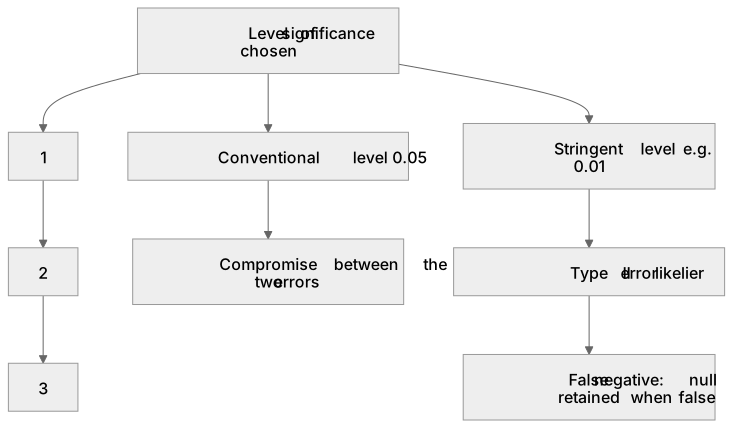
- The two errors trade off against each other: a lenient level such as 0.10 makes a Type I error likelier, a stringent one such as 0.01 makes a Type II error likelier, and 0.05 is the compromise.
- A stricter level is chosen where the consequences of a false positive are serious, for example in drug trials, or where a finding is being replicated.
Common mistakes and how to put them right
Swapping the errors over.
Put it right: Type I is claiming an effect that is not there; Type II is failing to find one that is.
Reading p less than or equal to 0.05 as '95% certain the hypothesis is true'.
Put it right: It is the probability of the data arising by chance, not the probability that the hypothesis is correct.
Applying one comparison rule to every test, when half of the named tests want the calculated value to be smaller than the critical value.
Ignoring the one-tailed and two-tailed columns, or using N where the test needs degrees of freedom, so the right test is read against the wrong critical value.
Saying a non-significant result means the null hypothesis is true, rather than that there is insufficient evidence to reject it.
Exam tips
- Write the conclusion in a fixed order: the calculated value, the critical value for that N and tail, which is bigger, the decision about the null hypothesis, and the level. All of it is creditable.
- When a question moves the level from 0.05 to 0.01 it is asking about error types: a stricter level cuts the risk of a Type I error and raises the risk of a Type II error. Say both halves.
- In an applied question name which error the researcher actually risks, using the scenario's own claim, rather than defining both errors in the abstract.
Try the lesson
The start of the Inferential testing: Probability and significance: use of statistical tables and critical values in interpretation of significance; Type I and Type II errors. lesson, made from checked teaching notes for this specification point.
Have a go first
Which of the following best describes a Type I error in the context of psychological research?
Listen
Probability is the risk of being wrong that a researcher agrees in advance to run. Psychology settles on p less than or equal to 0.05: the possibility that a result like this came about by chance is five in a hundred or fewer. Reading a table of critical values needs three pieces of information, whether the hypothesis was directional (one-tailed) or non-directional (two-tailed), the value of N or the degrees of freedom, and the level of significance, and then the rule for that test, since some require the calculated value to be smaller than the critical value and others larger. A Type I error is a false positive, rejecting a null hypothesis that was true, and gets likelier if the level is relaxed. A Type II error is a false negative, missing a real effect, and gets likelier as the level is made stricter. A strong answer earns marks for these points. The 5% level (p less than or equal to 0.05) is the conventional level of significance in psychology: no more than a five in a hundred possibility that the result is down to chance. Three things are needed to find a critical value in a table: N or the degrees of freedom, whether the test is one-tailed or two-tailed, and the chosen level of significance. For the sign test, Wilcoxon and Mann-Whitney the calculated value must be equal to or LESS than the critical value; for the t-tests, Spearman's rho, Pearson's r and chi-squared it must be equal to or GREATER. Type I error: the null hypothesis is rejected when it is in fact true, so an effect is claimed that does not exist (the optimistic error). Exam tip: Write the conclusion in a fixed order: the calculated value, the critical value for that N and tail, which is bigger, the decision about the null hypothesis, and the level. All of it is creditable.
See it
Key words
Say what each word means before you turn the card.
Level of significance and the 5% convention
Try answering aloud or in your head before turning the card.
One-tailed and two-tailed tests
Try answering aloud or in your head before turning the card.
Critical values, N and degrees of freedom
Try answering aloud or in your head before turning the card.
Type I error (false positive)
Try answering aloud or in your head before turning the card.
See every definition
- Level of significance and the 5% convention
- The conventional level in psychology is p less than or equal to 0.05, meaning no more than a five in a hundred possibility that the result is down to chance.
- One-tailed and two-tailed tests
- Whether the hypothesis was directional (one-tailed) or non-directional (two-tailed) is one of the three things needed to find a critical value in a table.
- Critical values, N and degrees of freedom
- Three things are needed to find a critical value in a table: N or the degrees of freedom, whether the test is one-tailed or two-tailed, and the chosen level of significance.
- Type I error (false positive)
- The null hypothesis is rejected when it is in fact true, so an effect is claimed that does not exist, and it gets likelier if the level is relaxed.
Label the diagram
Some boxes have lost their names. Pick the right name for each number.
1Box 1
2Box 2
3Box 3
There is more to this lesson
The full lesson goes on to check your understanding and help you earn the marks. Create a free account to carry on, with your progress saved.
A week of Premium from your first lesson · Then the free plan continues · No card, no charge
Test your understanding of Inferential testing: Probability and significance: use of statistical tables and critical values in interpretation of significance; Type I and Type II errors.
Active recall beats re-reading. Take an instant quiz now to test what you’ve learned and lock it into long-term memory.
A week of Premium from your first lesson · Then the free plan continues · No card, no charge