AQA · A-Level · Psychology
Course version: 7182-2025 · Exams from 2027
Students should demonstrate knowledge and understanding of the following…
Full specification wording
Research methods: Students should demonstrate knowledge and understanding of the following research methods, scientific processes and techniques of data handling and analysis, be familiar with their use and be aware of their strengths and limitations.
Research methods, scientific processes, and techniques of data handling and analysis are examined across all topics.
Checked against the AQA 7182-2025 specification (opens in a new tab) on .
- Point 1 of 7
- 3 key terms
Study notes
From the checked teaching notes for this specification point.
The idea
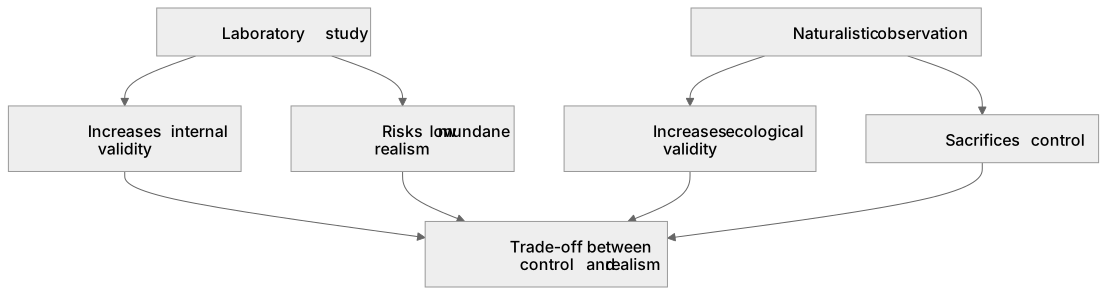
Research methods, scientific processes, and techniques of data handling and analysis are examined across all topics. A central theme is the trade-off between control and realism. A laboratory study increases internal validity, but risks low mundane realism. Conversely, a naturalistic observation increases ecological validity but sacrifices control. Data analysis requires selecting statistical tests based on design and level of measurement. Graph choice depends on data type and whether testing a difference or correlation. Central tendency depends on the level of measurement and data distribution, such as skewness or outliers.
What earns the marks
- Identifying the method used in the stem and justifying that identification from a detail in the stem, demonstrating knowledge and understanding.
- Internal validity: whether the effect was really caused by the manipulated variable rather than by an extraneous or confounding one.
- Reliability as consistency, established by test-retest, inter-observer agreement or split-half, and kept distinct from validity.
- Strengths and limitations applied to the scenario, with the consequence stated: what the weakness does to the conclusion.
- Data handling: graph choice depends on data type and whether testing a difference or correlation, while central tendency depends on the level of measurement and data distribution (e.g., skewness).
Common mistakes and how to put them right
Reciting a memorised list of strengths and limitations that never mentions the study in the stem, which caps an application answer at the lower mark bands.
Put it right: Link to the scenario.
Using reliability and validity as synonyms, so that 'the questionnaire was unreliable' is offered as evidence that it measured the wrong thing.
Put it right: Keep consistency and accuracy distinct.
Assuming central tendency depends solely on the level of measurement, ignoring that extreme outliers make the median more appropriate than the mean for interval data.
Exam tips
- Quote the stem. Naming the participants, the setting or the measure from the scenario is what turns a generic point into an applied mark.
- For 'explain one limitation' write three parts: name it, say how it operates in this study, say what it does to the conclusion.
Try the lesson
The start of the Research methods: Students should demonstrate knowledge and understanding of the following research methods, scientific processes and techniques of data handling and analysis, be familiar with their use and be aware of their strengths and limitations. lesson, made from checked teaching notes for this specification point.
Have a go first
Which of the following is a primary strength of using a repeated measures design in a psychological experiment?
Listen
Research methods, scientific processes, and techniques of data handling and analysis are examined across all topics. A central theme is the trade-off between control and realism. A laboratory study increases internal validity, but risks low mundane realism. Conversely, a naturalistic observation increases ecological validity but sacrifices control. Data analysis requires selecting statistical tests based on design and level of measurement. Graph choice depends on data type and whether testing a difference or correlation. Central tendency depends on the level of measurement and data distribution, such as skewness or outliers. A strong answer earns marks for these points. Identifying the method used in the stem and justifying that identification from a detail in the stem, demonstrating knowledge and understanding. Internal validity: whether the effect was really caused by the manipulated variable rather than by an extraneous or confounding one. Reliability as consistency, established by test-retest, inter-observer agreement or split-half, and kept distinct from validity. Strengths and limitations applied to the scenario, with the consequence stated: what the weakness does to the conclusion. Exam tip: Quote the stem. Naming the participants, the setting or the measure from the scenario is what turns a generic point into an applied mark.
See it
Key words
Say what each word means before you turn the card.
Control versus realism
Try answering aloud or in your head before turning the card.
Internal validity
Try answering aloud or in your head before turning the card.
Reliability
Try answering aloud or in your head before turning the card.
See every definition
- Control versus realism
- A central trade-off in which a laboratory study increases internal validity but risks low mundane realism, while a naturalistic observation increases ecological validity but sacrifices control.
- Internal validity
- Whether the effect was really caused by the manipulated variable rather than by an extraneous or confounding one.
- Reliability
- Consistency, established by test-retest, inter-observer agreement or split-half, and kept distinct from validity.
Label the diagram
Some boxes have lost their names. Pick the right name for each number.
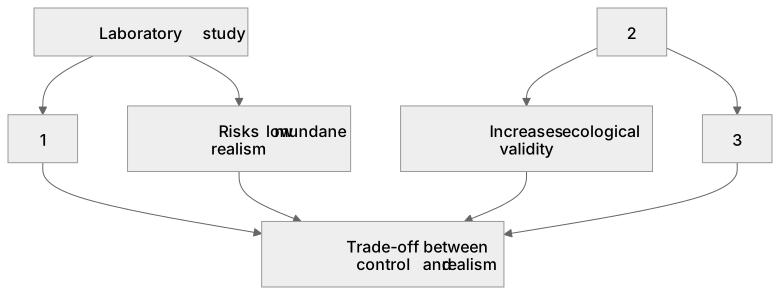
1Box 1
2Box 2
3Box 3
There is more to this lesson
The full lesson goes on to check your understanding and help you earn the marks. Create a free account to carry on, with your progress saved.
A week of Premium from your first lesson · Then the free plan continues · No card, no charge
Test your understanding of Research methods: Students should demonstrate knowledge and understanding of the following research methods, scientific processes and techniques of data handling and analysis, be familiar with their use and be aware of their strengths and limitations.
Active recall beats re-reading. Take an instant quiz now to test what you’ve learned and lock it into long-term memory.
A week of Premium from your first lesson · Then the free plan continues · No card, no charge