AQA · GCSE · Biology
Course version: 8461 · Version from Sept 2018
Students should be able to extract and interpret information from charts,…
Full specification wording
Abiotic factors: Students should be able to extract and interpret information from charts, graphs and tables relating to the effect of abiotic factors on organisms within a community.
Charts, graphs and tables present ecological data such as the number of organisms at different light intensities, temperatures or oxygen concentrations.
Checked against the AQA 8461 specification (opens in a new tab) on .
- Point 3 of 3
- 3 key terms
Study notes
From the checked teaching notes for this specification point.
The idea
Charts, graphs and tables present ecological data such as the number of organisms at different light intensities, temperatures or oxygen concentrations. To extract information, read the axes, units, labels and keys carefully, then locate the value or category you need. To interpret, describe the overall trend, quote figures with units, and explain the trend using biology. For example, a graph showing plant height rising as light intensity increases up to a plateau can be explained by photosynthesis increasing until another factor becomes limiting. A table of aquatic invertebrate numbers against oxygen concentration can show that most species peak at higher oxygen levels, which links to aerobic respiration. Always connect the pattern in the data to a named abiotic factor and its effect on the organisms.
What earns the marks
- Reads axes, units, labels and keys correctly before quoting any value.
- Describes the overall trend, such as increase, decrease, peak or plateau.
- Quotes specific values or ranges from the chart, graph or table with correct units.
- Compares data for different species, sites or conditions where the resource allows.
- Explains the trend by linking the abiotic factor to a named biological process.
- Recognises anomalies or limitations in the data and avoids overgeneralising from a single point.
Common mistakes and how to put them right
Reading the wrong axis or ignoring the units.
Put it right: Check both axes and the key before quoting a value.
Describing each point separately instead of stating the overall trend.
Put it right: Summarise the pattern first, then support it with figures.
Giving a biological explanation that does not name the abiotic factor.
Put it right: State the factor and the process it affects.
Exam tips
- Quote figures with units and say what they show, rather than leaving numbers unexplained.
- Use the pattern words increase, decrease, plateau and optimum to describe trends precisely.
- When explaining, name the abiotic factor and the process, such as photosynthesis or respiration, in the same sentence.
Try the lesson
The start of the Abiotic factors: Students should be able to extract and interpret information from charts, graphs and tables relating to the effect of abiotic factors on organisms within a community. lesson, made from checked teaching notes for this specification point.
Have a go first
A student records the number of mayfly nymphs and the oxygen concentration at five points along a stream.
Point A: 2.1 mg/dm³ oxygen, 4 nymphs Point B: 4.5 mg/dm³ oxygen, 12 nymphs Point C: 6.8 mg/dm³ oxygen, 27 nymphs Point D: 8.2 mg/dm³ oxygen, 45 nymphs Point E: 10.5 mg/dm³ oxygen, 68 nymphs
What conclusion can be drawn from this data about the effect of oxygen concentration on mayfly nymphs?
Listen
Charts, graphs and tables present ecological data such as the number of organisms at different light intensities, temperatures or oxygen concentrations. To extract information, read the axes, units, labels and keys carefully, then locate the value or category you need. To interpret, describe the overall trend, quote figures with units, and explain the trend using biology. For example, a graph showing plant height rising as light intensity increases up to a plateau can be explained by photosynthesis increasing until another factor becomes limiting. A table of aquatic invertebrate numbers against oxygen concentration can show that most species peak at higher oxygen levels, which links to aerobic respiration. Always connect the pattern in the data to a named abiotic factor and its effect on the organisms. A strong answer earns marks for these points. Reads axes, units, labels and keys correctly before quoting any value. Describes the overall trend, such as increase, decrease, peak or plateau. Quotes specific values or ranges from the chart, graph or table with correct units. Compares data for different species, sites or conditions where the resource allows. A common slip: Reading the wrong axis or ignoring the units. Instead, check both axes and the key before quoting a value. Exam tip: Quote figures with units and say what they show, rather than leaving numbers unexplained.
See it
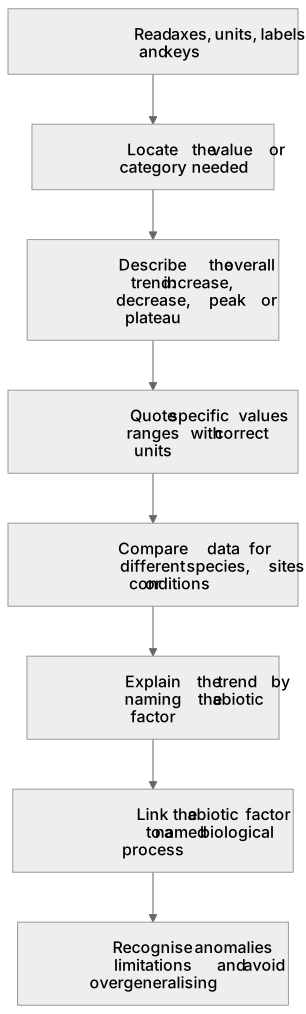
Put it in order
Put these steps in the order they happen.
- 1. Compare data for different species, sites or conditions
- 2. Recognise anomalies or limitations and avoid overgeneralising
- 3. Explain the trend by naming the abiotic factor
- 4. Read axes, units, labels and keys
- 5. Locate the value or category needed
- 6. Link the abiotic factor to a named biological process
- 7. Describe the overall trend: increase, decrease, peak or plateau
- 8. Quote specific values or ranges with correct units
Key words
Say what each word means before you turn the card.
Extract information
Try answering aloud or in your head before turning the card.
Interpret information
Try answering aloud or in your head before turning the card.
Trend
Try answering aloud or in your head before turning the card.
See every definition
- Extract information
- Read the axes, units, labels and keys carefully, then locate the value or category you need.
- Interpret information
- Describe the overall trend, quote figures with units, and explain the trend using biology.
- Trend
- The overall pattern in the data, such as increase, decrease, peak or plateau.
Label the diagram
Some boxes have lost their names. Pick the right name for each number.
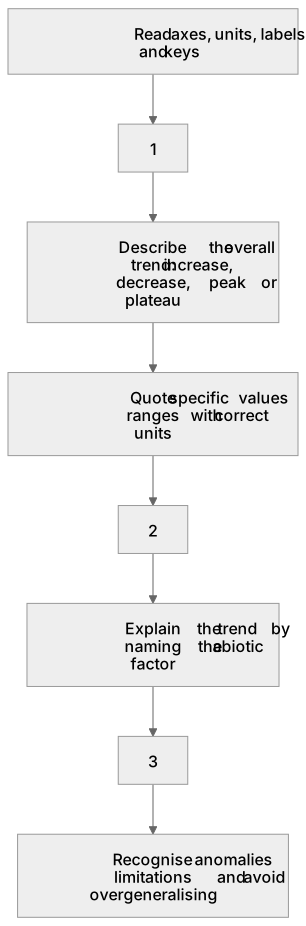
1Box 1
2Box 2
3Box 3
There is more to this lesson
The full lesson goes on to check your understanding and help you earn the marks. Create a free account to carry on, with your progress saved.
A week of Premium from your first lesson · Then the free plan continues · No card, no charge
Test your understanding of Abiotic factors: Students should be able to extract and interpret information from charts, graphs and tables relating to the effect of abiotic factors on organisms within a community.
Active recall beats re-reading. Take an instant quiz now to test what you’ve learned and lock it into long-term memory.
A week of Premium from your first lesson · Then the free plan continues · No card, no charge