AQA · GCSE · Biology
Course version: 8461 · Version from Sept 2018
Students should be able to extract and interpret information from charts,…
Full specification wording
Communities: Students should be able to extract and interpret information from charts, graphs and tables relating to the interaction of organisms within a community.
This skill requires reading data from charts, graphs and tables about organisms in a community and using it to describe or explain interactions.
Checked against the AQA 8461 specification (opens in a new tab) on .
- Point 11 of 11
- 3 key terms
Study notes
From the checked teaching notes for this specification point.
The idea
This skill requires reading data from charts, graphs and tables about organisms in a community and using it to describe or explain interactions. You may be given a line graph showing predator and prey populations over time, a bar chart of species numbers, or a table of environmental measurements. To extract information, read the axes, units, labels and key carefully, then identify values or trends. To interpret, link patterns to biological ideas such as predation, competition or interdependence. For example, a graph may show prey numbers falling after predator numbers rise, which you can explain as increased predation. Always quote data to support your answer.
What earns the marks
- Reads axes, labels, units and keys accurately to extract values from charts, graphs or tables.
- Identifies trends or patterns, such as increases, decreases, peaks or cycles, in the data.
- Links patterns in the data to interactions between organisms, such as predation, competition or interdependence.
- Uses numerical evidence from the resource to support an explanation.
- Compares data for two or more species or factors to explain a relationship within the community.
Common mistakes and how to put them right
Ignoring the units or scale on an axis.
Put it right by checking units and using the correct scale when reading values.
Describing a trend without linking it to a biological interaction.
Put it right by explaining what the pattern shows about organisms in the community.
Quoting data without comparing it to another point or species.
Put it right by making a direct comparison to support the interpretation.
Exam tips
- Quote specific figures from the graph or table, including units, to support each point you make.
- Use comparative language such as higher than, lower than or increases while to describe relationships.
- Check whether the question asks you to extract, interpret or both, and make sure your answer does what is asked.
Try the lesson
The start of the Communities: Students should be able to extract and interpret information from charts, graphs and tables relating to the interaction of organisms within a community. lesson, made from checked teaching notes for this specification point.
Have a go first
A student recorded the population of two species in a woodland habitat. The data is shown in the table:
| Year | Number of rabbits | Number of foxes |
|---|---|---|
| Year 1 | 50 | 5 |
| Year 2 | 30 | 15 |
What was the change in the number of rabbits between Year 1 and Year 2?
Listen
This skill requires reading data from charts, graphs and tables about organisms in a community and using it to describe or explain interactions. You may be given a line graph showing predator and prey populations over time, a bar chart of species numbers, or a table of environmental measurements. To extract information, read the axes, units, labels and key carefully, then identify values or trends. To interpret, link patterns to biological ideas such as predation, competition or interdependence. For example, a graph may show prey numbers falling after predator numbers rise, which you can explain as increased predation. Always quote data to support your answer. A strong answer earns marks for these points. Reads axes, labels, units and keys accurately to extract values from charts, graphs or tables. Identifies trends or patterns, such as increases, decreases, peaks or cycles, in the data. Links patterns in the data to interactions between organisms, such as predation, competition or interdependence. Uses numerical evidence from the resource to support an explanation. A common slip: Ignoring the units or scale on an axis. Instead, checking units and using the correct scale when reading values. Exam tip: Quote specific figures from the graph or table, including units, to support each point you make.
See it
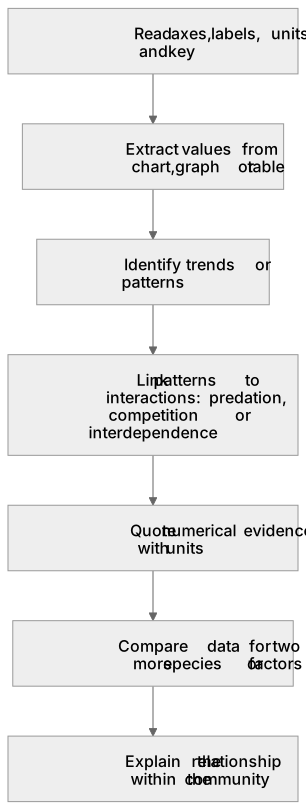
Put it in order
Put these steps in the order they happen.
- 1. Explain the relationship within the community
- 2. Compare data for two or more species or factors
- 3. Identify trends or patterns
- 4. Quote numerical evidence with units
- 5. Read axes, labels, units and key
- 6. Extract values from chart, graph or table
- 7. Link patterns to interactions: predation, competition or interdependence
Key words
Say what each word means before you turn the card.
Data interpretation
Try answering aloud or in your head before turning the card.
Interactions in communities
Try answering aloud or in your head before turning the card.
Evidence-based explanation
Try answering aloud or in your head before turning the card.
See every definition
- Data interpretation
- Linking patterns in charts, graphs or tables to biological ideas such as predation, competition or interdependence.
- Interactions in communities
- Relationships between organisms within a community, such as predation, competition or interdependence, which patterns in data can be linked to.
- Evidence-based explanation
- An explanation that uses numerical evidence from the resource, quoting data to support each point made.
Label the diagram
Some boxes have lost their names. Pick the right name for each number.
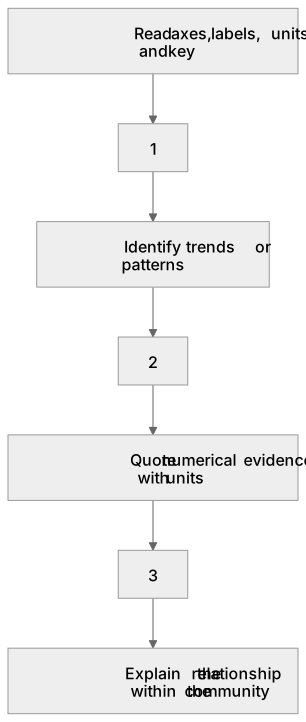
1Box 1
2Box 2
3Box 3
There is more to this lesson
The full lesson goes on to check your understanding and help you earn the marks. Create a free account to carry on, with your progress saved.
A week of Premium from your first lesson · Then the free plan continues · No card, no charge
Test your understanding of Communities: Students should be able to extract and interpret information from charts, graphs and tables relating to the interaction of organisms within a community.
Active recall beats re-reading. Take an instant quiz now to test what you’ve learned and lock it into long-term memory.
A week of Premium from your first lesson · Then the free plan continues · No card, no charge